QUESTION IMAGE
Question
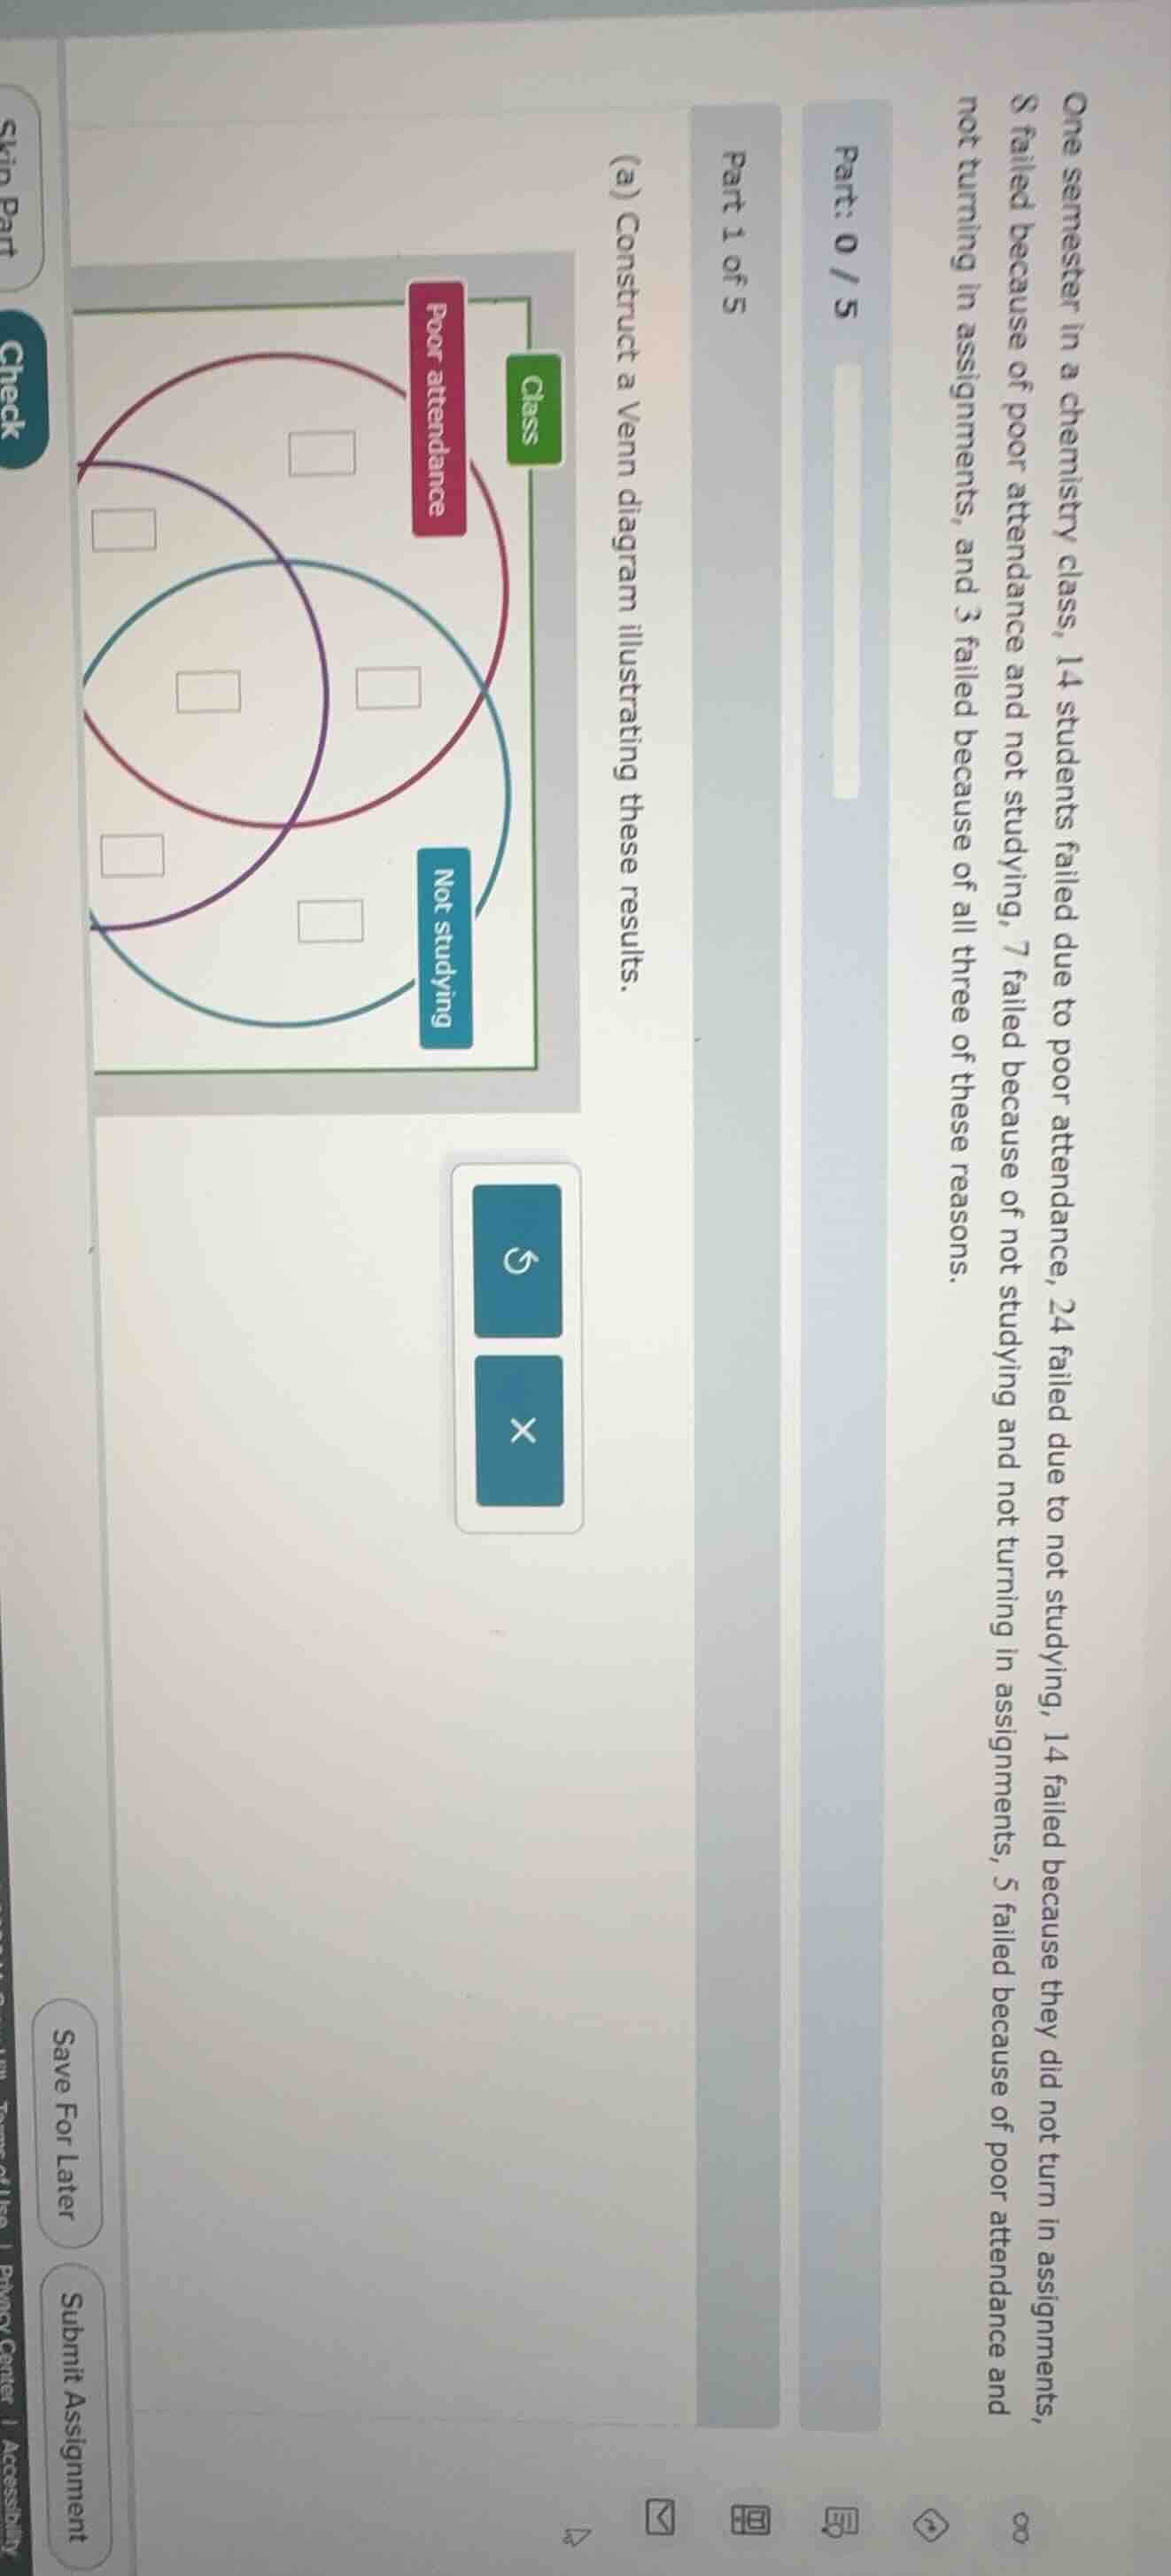
one semester in a chemistry class, 14 students failed due to poor attendance, 24 failed due to not studying, 14 failed because they did not turn in assignments, 8 failed because of poor attendance and not studying, 7 failed because of not studying and not turning in assignments, 5 failed because of poor attendance and not turning in assignments, and 3 failed because of all three of these reasons. (a) construct a venn diagram illustrating these results.
Step1: Define sets
Let $A$ = Poor attendance, $B$ = Not studying, $C$ = Not turning in assignments
Step2: Fill triple overlap first
Given all three reasons: $n(A \cap B \cap C) = 3$
Step3: Fill pairwise overlaps (subtract triple)
- $n(A \cap B \text{ only}) = 8 - 3 = 5$
- $n(B \cap C \text{ only}) = 7 - 3 = 4$
- $n(A \cap C \text{ only}) = 5 - 3 = 2$
Step4: Fill single-set only regions
- $n(A \text{ only}) = 14 - 5 - 3 - 2 = 4$
- $n(B \text{ only}) = 24 - 5 - 3 - 4 = 12$
- $n(C \text{ only}) = 14 - 2 - 3 - 4 = 5$
Step5: Verify total failed students
Total = $4 + 12 + 5 + 5 + 4 + 2 + 3 = 35$

Snap & solve any problem in the app
Get step-by-step solutions on Sovi AI
Photo-based solutions with guided steps
Explore more problems and detailed explanations
The Venn diagram values (in order of the empty boxes, mapped to the regions):
- Poor attendance only: $4$
- Poor attendance and Not studying only: $5$
- Not studying only: $12$
- Poor attendance, Not studying, and Not turning in assignments: $3$
- Not studying and Not turning in assignments only: $4$
- Not turning in assignments only: $5$
- Poor attendance and Not turning in assignments only: $2$
(When filling the diagram:
- Top red circle (Poor attendance): top box = 4, left overlap box = 5, center box = 3, right overlap box = 2
- Bottom blue circle (Not studying): left overlap box = 5, bottom-left box = 12, center box = 3, bottom-right overlap box = 4
- The remaining box (Not turning in assignments only) = 5)