QUESTION IMAGE
Question
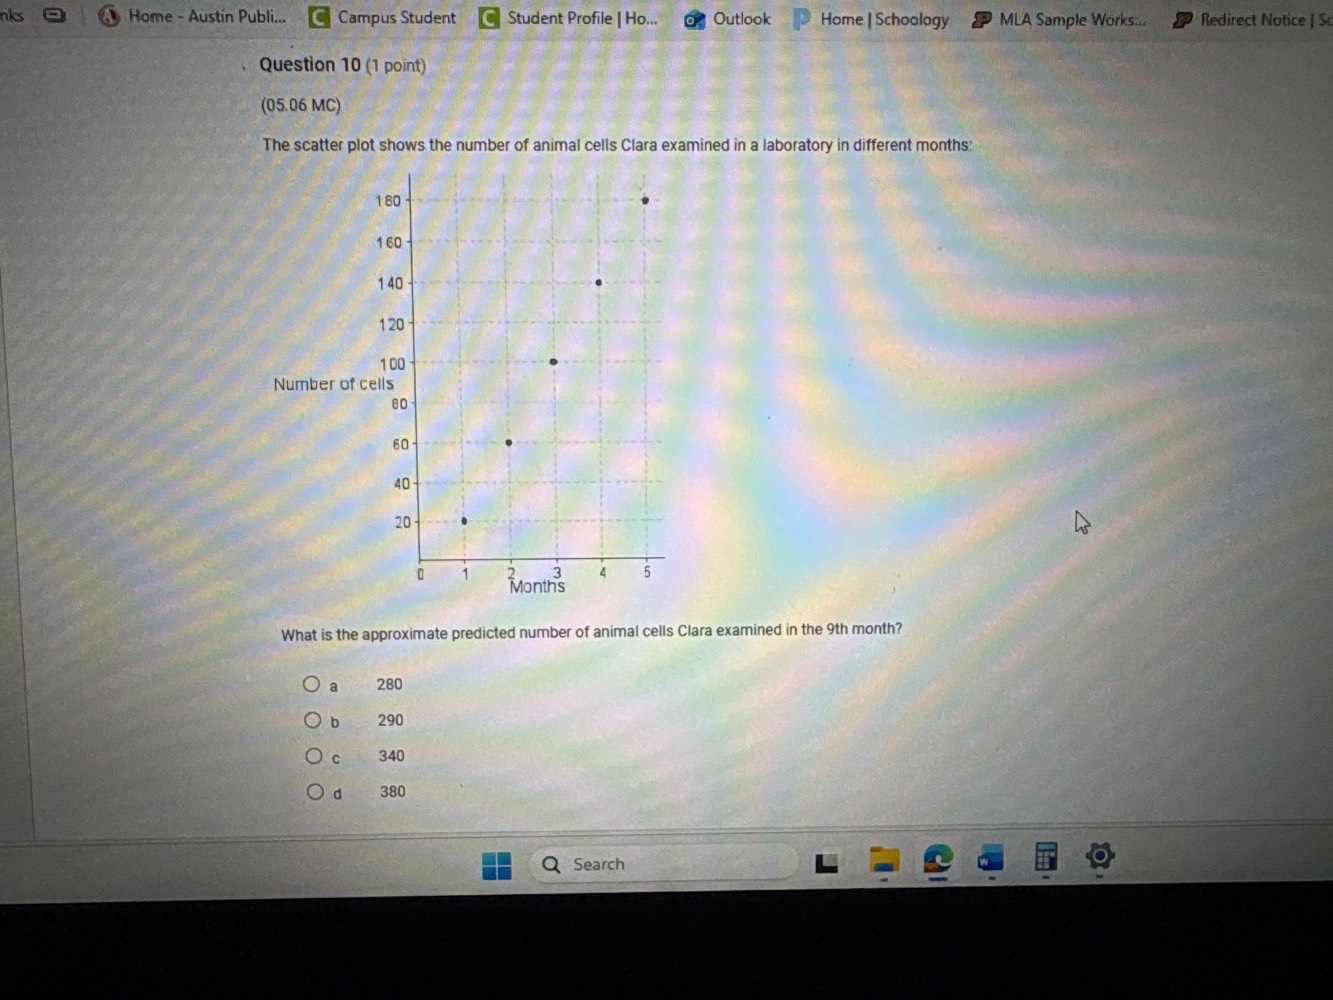
question 10 (1 point)(05.06 mc)the scatter plot shows the number of animal cells clara examined in a laboratory in different months:number of cellsmonthswhat is the approximate predicted number of animal cells clara examined in the 9th month?a 280b 290c 340d 380
Step1: Identify data points
Points: $(1,20), (2,60), (3,100), (4,140), (5,180)$
Step2: Find slope of trend line
Slope $m = \frac{60-20}{2-1} = 40$
Step3: Find y-intercept of line
Use $(1,20)$: $20 = 40(1) + b \implies b = -20$
Step4: Write trend line equation
$y = 40x - 20$
Step5: Predict for x=9
$y = 40(9) - 20$

Snap & solve any problem in the app
Get step-by-step solutions on Sovi AI
Photo-based solutions with guided steps
Explore more problems and detailed explanations
a. 280