QUESTION IMAGE
Question
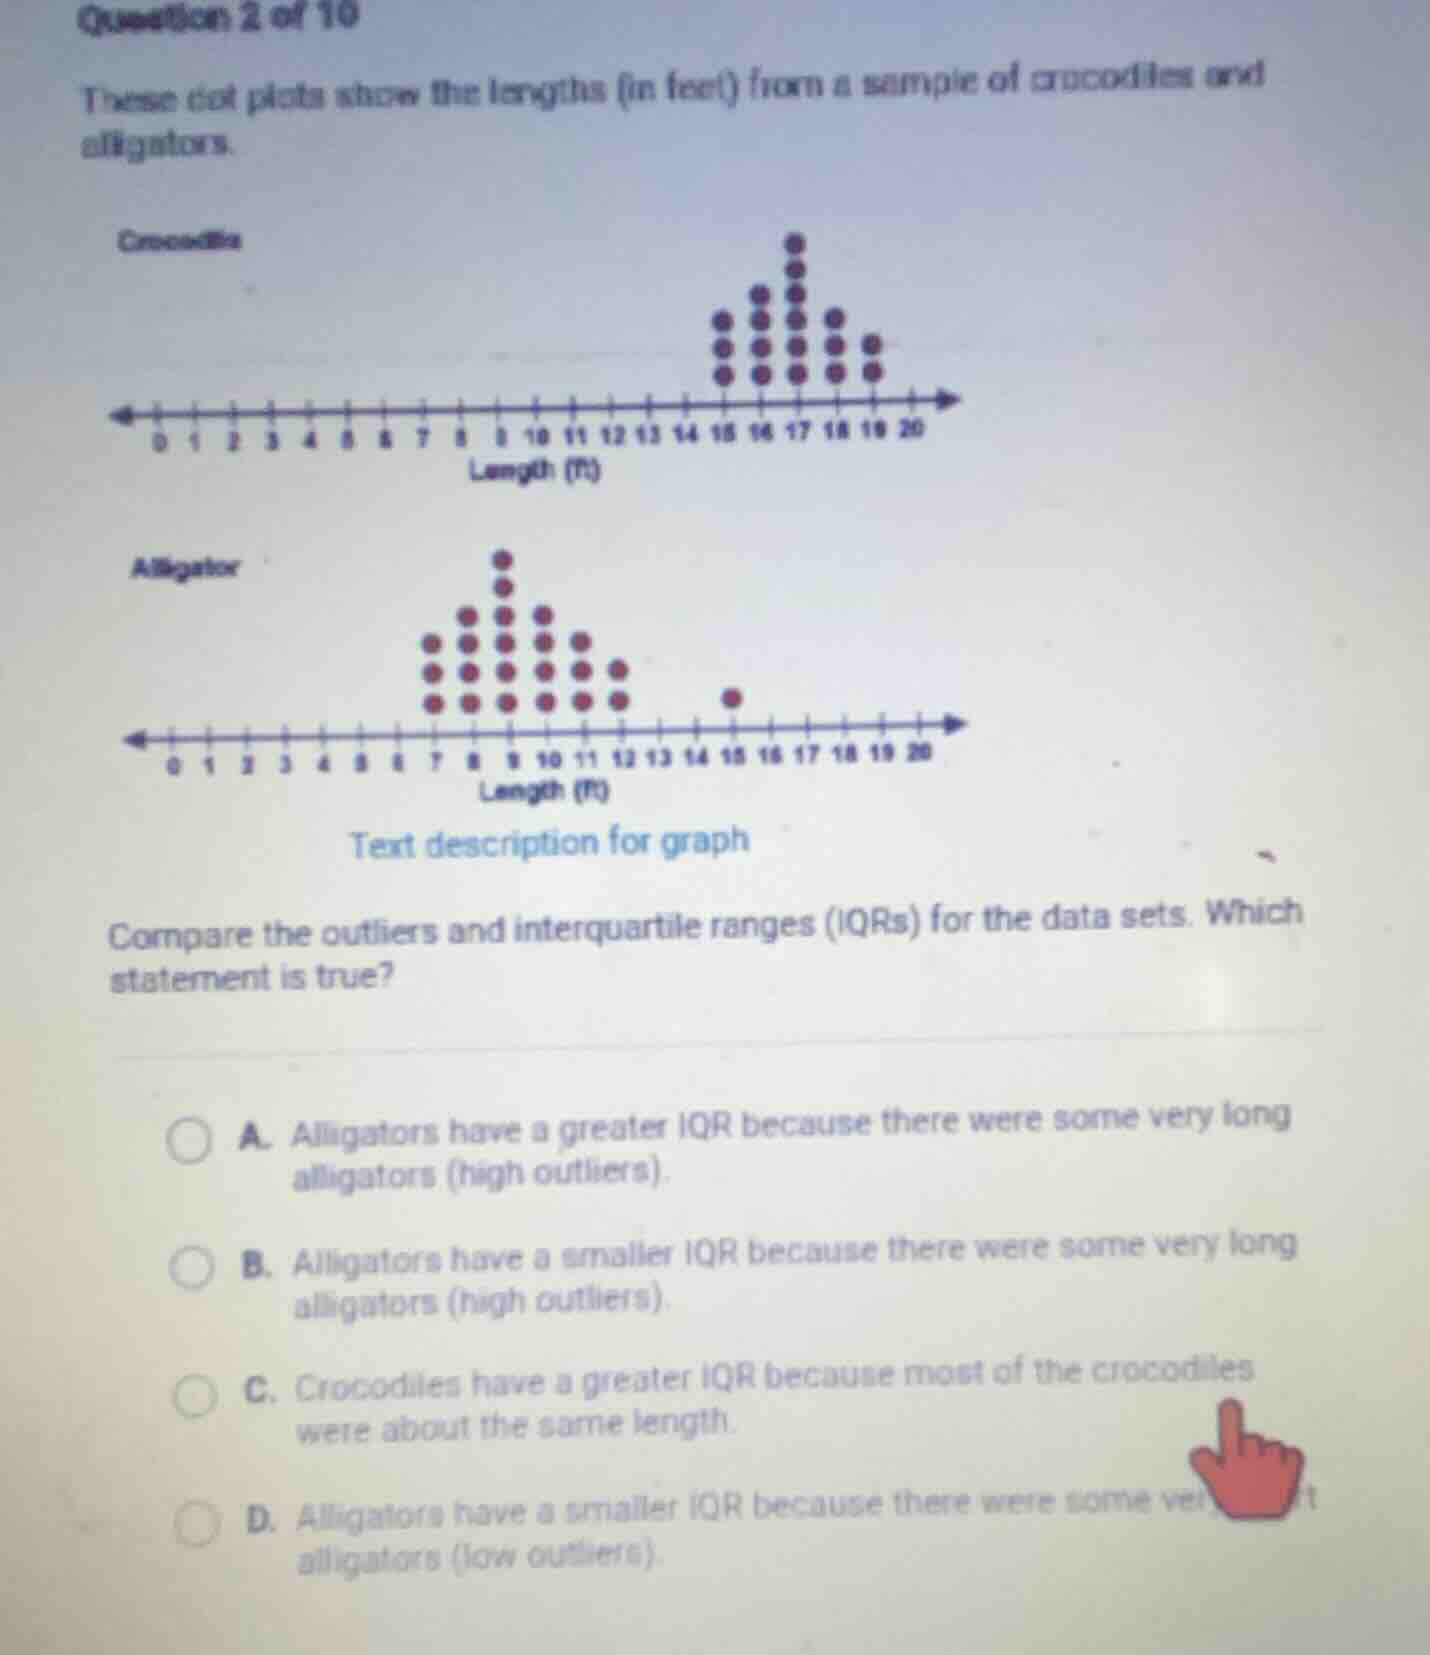
question 2 of 10
these dot plots show the lengths (in feet) from a sample of crocodiles and alligators.
crocodile
dot plot for crocodile length
alligator
dot plot for alligator length
text description for graph
compare the outliers and interquartile ranges (iqrs) for the data sets. which statement is true?
a. alligators have a greater iqr because there were some very long alligators (high outliers).
b. alligators have a smaller iqr because there were some very long alligators (high outliers).
c. crocodiles have a greater iqr because most of the crocodiles were about the same length.
d. alligators have a smaller iqr because there were some ver alligators (low outliers).
- First, recall the concept of IQR (Interquartile Range) and outliers. The IQR is the range of the middle 50% of the data, calculated as \( IQR = Q_3 - Q_1 \), where \( Q_1 \) is the first quartile and \( Q_3 \) is the third quartile. Outliers are data points that lie outside the range \( Q_1 - 1.5 \times IQR \) to \( Q_3 + 1.5 \times IQR \).
- Analyze the dot plots:
- For Alligators: Most of the data (the main cluster) is between 7 - 12 feet, and there is a high outlier (around 15 feet). The main cluster is relatively narrow, so the spread of the middle 50% (IQR) should be smaller.
- For Crocodiles: The data is clustered between 15 - 19 feet, with a more spread - out main cluster (since the dots are spread from 15 to 19, with a peak at 17). So the IQR for Crocodiles should be larger? Wait, no, let's re - evaluate. Wait, the Alligator's main data (excluding the outlier) is from around 7 to 12, so the middle 50% is within a smaller range. The Crocodile's data is from 15 to 19, but the spread of the middle 50%: let's think about the quartiles.
- The key point is that outliers do not affect the IQR (because IQR is based on \( Q_1 \) and \( Q_3 \), which are based on the middle 50% of the data, excluding the outliers in terms of the calculation of quartiles? Wait, no, quartiles are calculated on the entire data set, but the main cluster for Alligators is narrow. The Alligator's data has a main cluster (most of the dots) between 7 and 12, so the interquartile range (the range of the middle 50% of the data) will be smaller because the middle 50% is within a smaller interval. The Crocodile's data is more spread out in the main cluster (from 15 to 19, with a peak at 17, but the dots are spread from 15 to 19, so the middle 50% is more spread). Wait, but the options:
- Option A: Says Alligators have a greater IQR because of high outliers. But outliers don't increase IQR (IQR is about the middle 50%, outliers are outside). So A is wrong.
- Option B: Alligators have a smaller IQR because there were some very long alligators (high outliers). The main cluster of Alligators is narrow, so the middle 50% (IQR) is small. The high outlier is outside the main cluster, so the IQR is determined by the main cluster. So this makes sense.
- Option C: Crocodiles have a greater IQR because most of the crocodiles were about the same length. If most were about the same length, the IQR would be small, so C is wrong.
- Option D: Says low outliers, but the outlier for Alligators is a high outlier (15 is higher than the main cluster of 7 - 12), so D is wrong.

Snap & solve any problem in the app
Get step-by-step solutions on Sovi AI
Photo-based solutions with guided steps
Explore more problems and detailed explanations
B. Alligators have a smaller IQR because there were some very long alligators (high outliers).