QUESTION IMAGE
Question
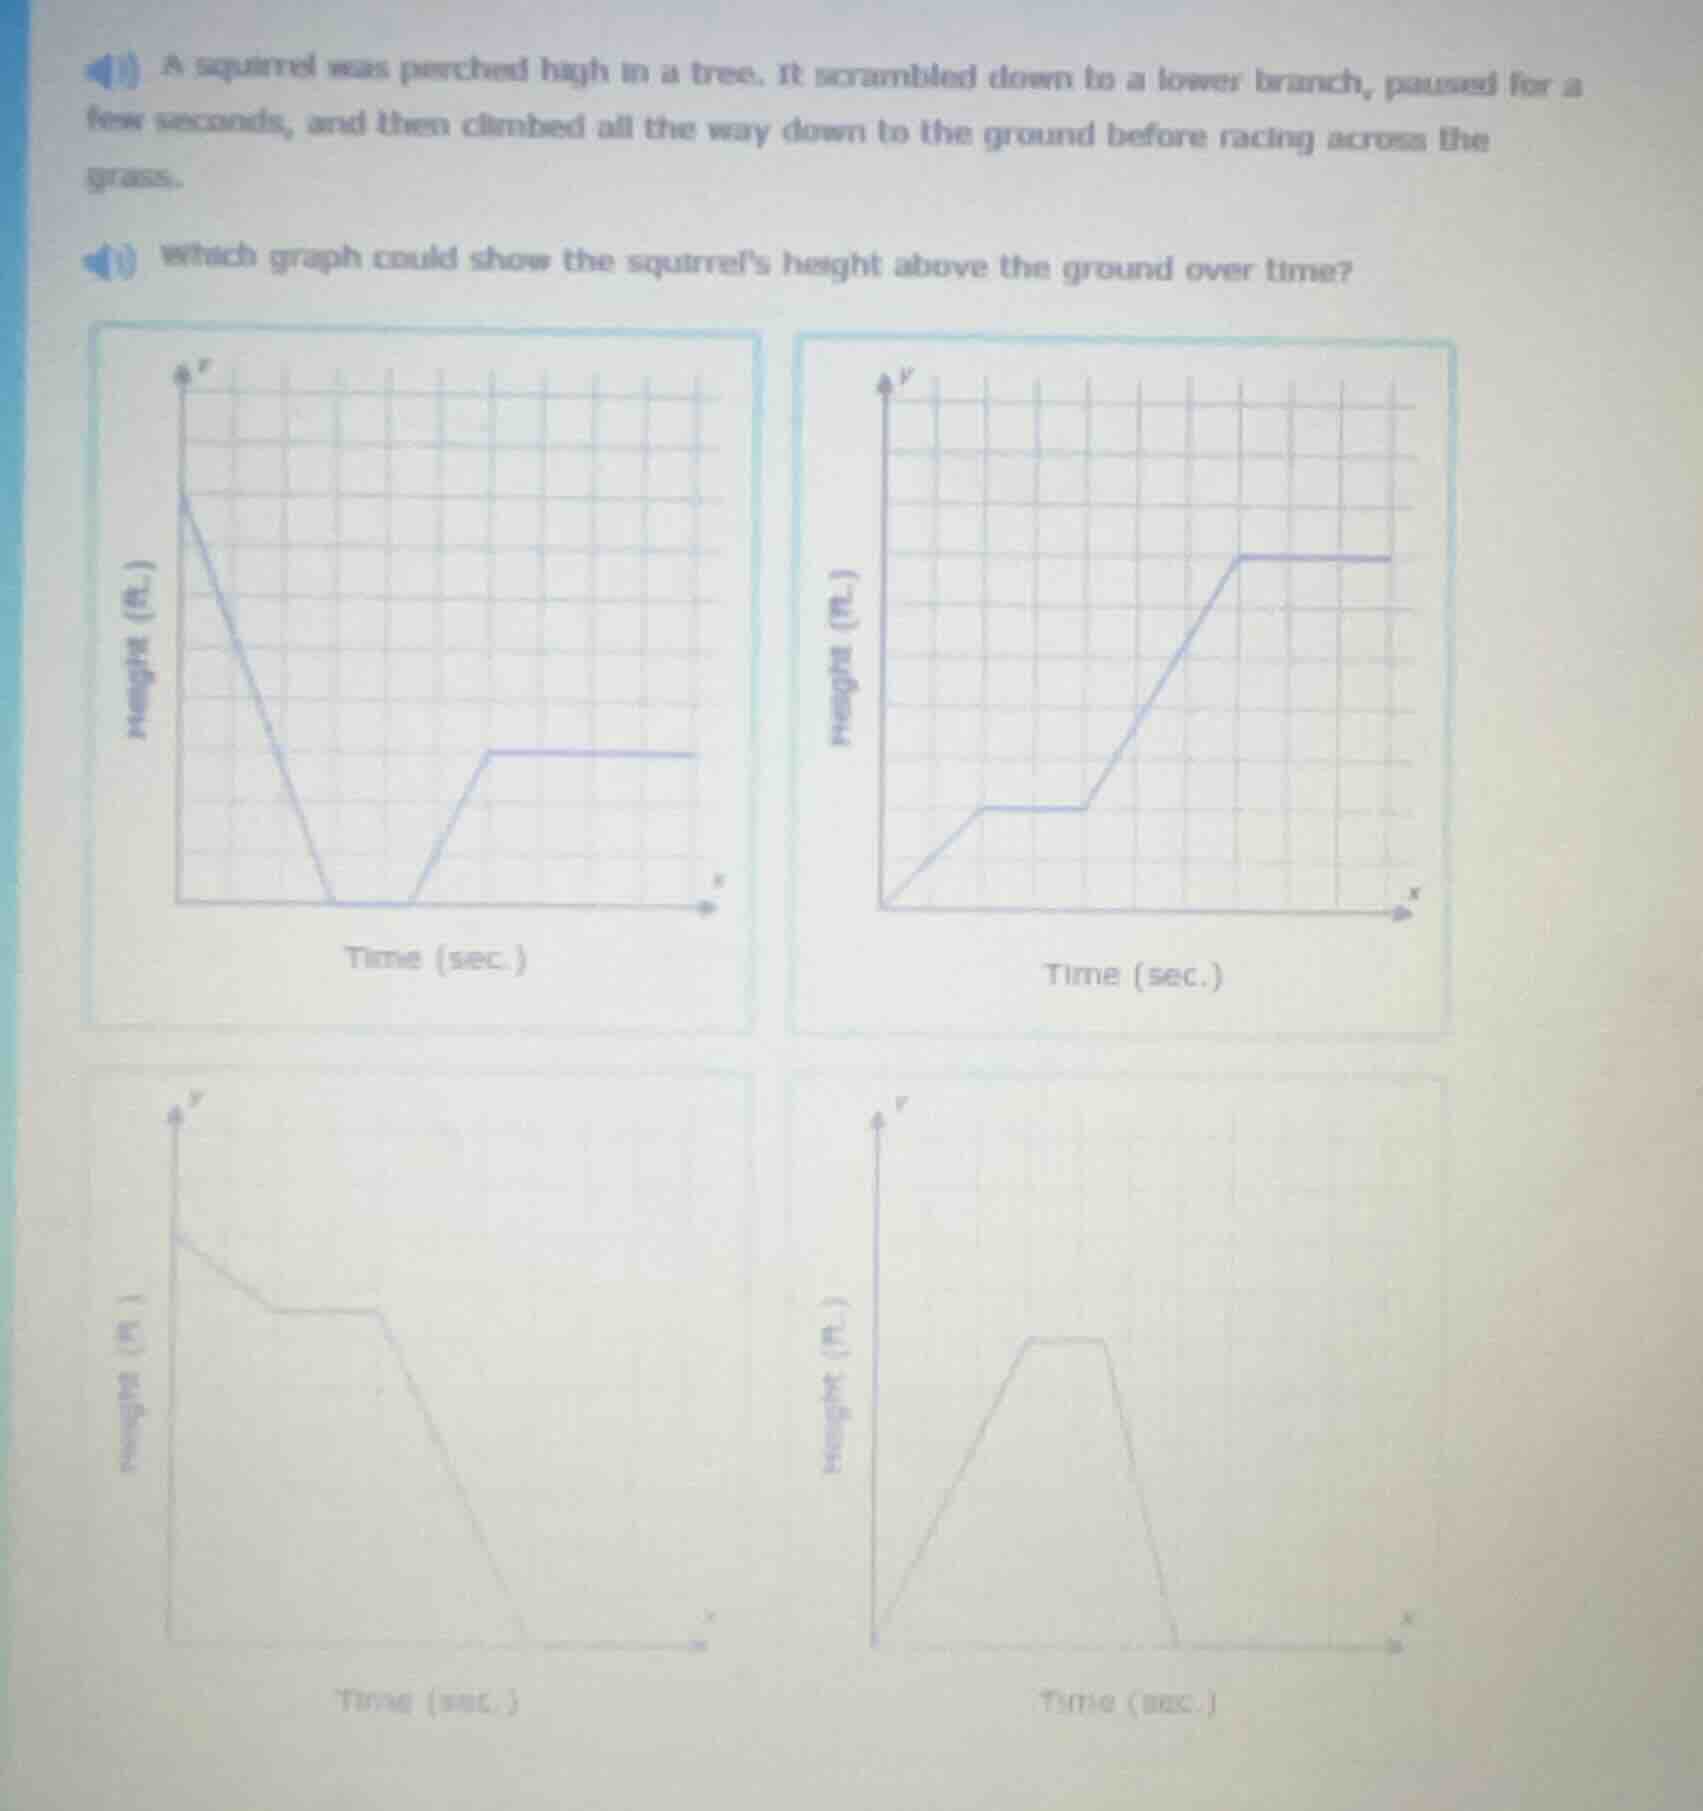
a squirrel was perched high in a tree. it scrambled down to a lower branch, paused for a few seconds, and then climbed all the way down to the ground before racing across the grass. which graph could show the squirrels height above the ground over time?
Brief Explanations
- The squirrel starts at a high, constant height, so the graph begins at a positive y-value.
- It climbs down to a lower branch: height decreases over time (downward sloping line).
- It pauses: height stays constant (horizontal line).
- It climbs to the ground: height decreases to 0 (downward sloping line to y=0).
- It races across grass: height stays at 0 (horizontal line at y=0).
Only the bottom-left graph matches this sequence.

Snap & solve any problem in the app
Get step-by-step solutions on Sovi AI
Photo-based solutions with guided steps
Explore more problems and detailed explanations
The bottom-left graph (third option, starting at high height, decreasing, pausing, decreasing to 0, staying at 0)