QUESTION IMAGE
Question
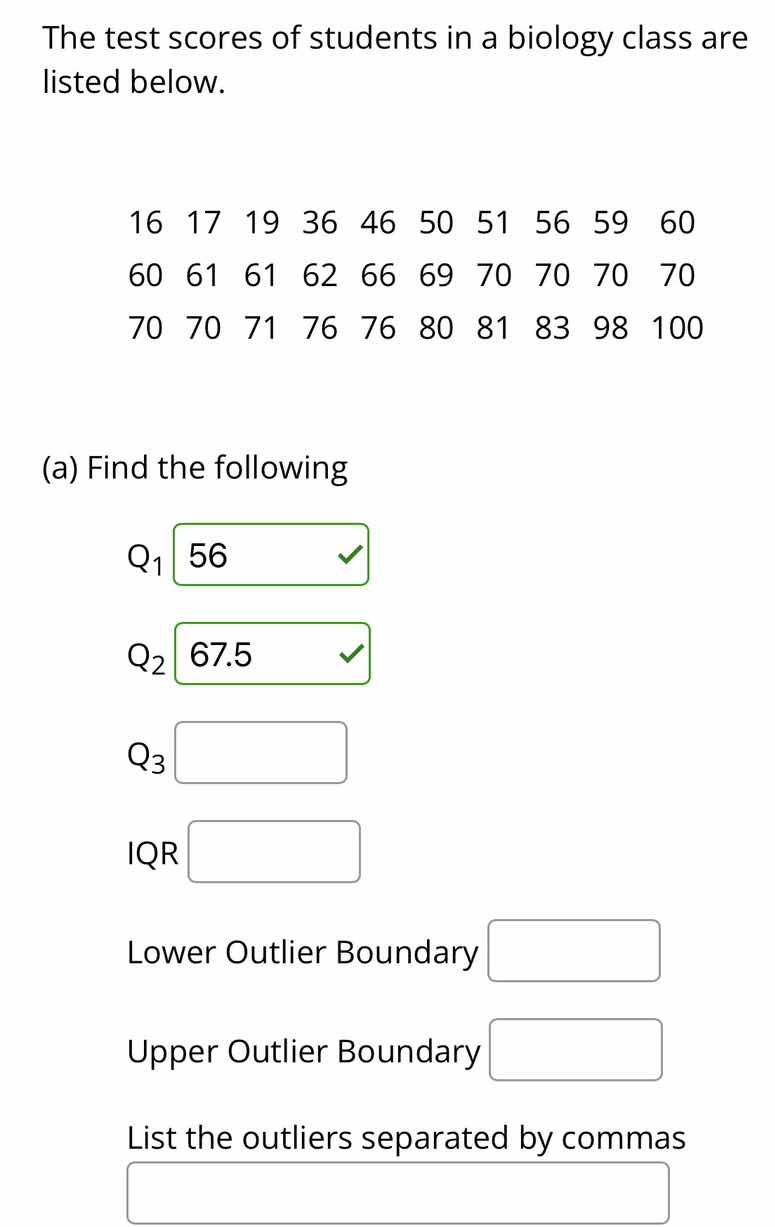
the test scores of students in a biology class are listed below.
16 17 19 36 46 50 51 56 59 60
60 61 61 62 66 69 70 70 70 70
70 70 71 76 76 80 81 83 98 100
(a) find the following
$q_1$ 56
$q_2$ 67.5
$q_3$
iqr
lower outlier boundary
upper outlier boundary
list the outliers separated by commas
Step1: Find total data points
There are 30 data points, $n=30$.
Step2: Split data for Q3
Upper half: values after $Q_2$ (15th-30th): 70,70,70,70,70,71,76,76,80,81,83,98,100
Step3: Calculate Q3 position
$Q_3$ = median of upper half. For 15 values, 8th value: $Q_3=76$
Step4: Calculate IQR
$IQR = Q_3 - Q_1$
$IQR = 76 - 56 = 20$
Step5: Find lower outlier boundary
Lower boundary = $Q_1 - 1.5\times IQR$
$56 - 1.5\times20 = 56 - 30 = 26$
Step6: Find upper outlier boundary
Upper boundary = $Q_3 + 1.5\times IQR$
$76 + 1.5\times20 = 76 + 30 = 106$
Step7: Identify outliers
Values <26 or >106: 16,17,19

Snap & solve any problem in the app
Get step-by-step solutions on Sovi AI
Photo-based solutions with guided steps
Explore more problems and detailed explanations
$Q_3$: 76
IQR: 20
Lower Outlier Boundary: 26
Upper Outlier Boundary: 106
Outliers: 16, 17, 19