QUESTION IMAGE
Question
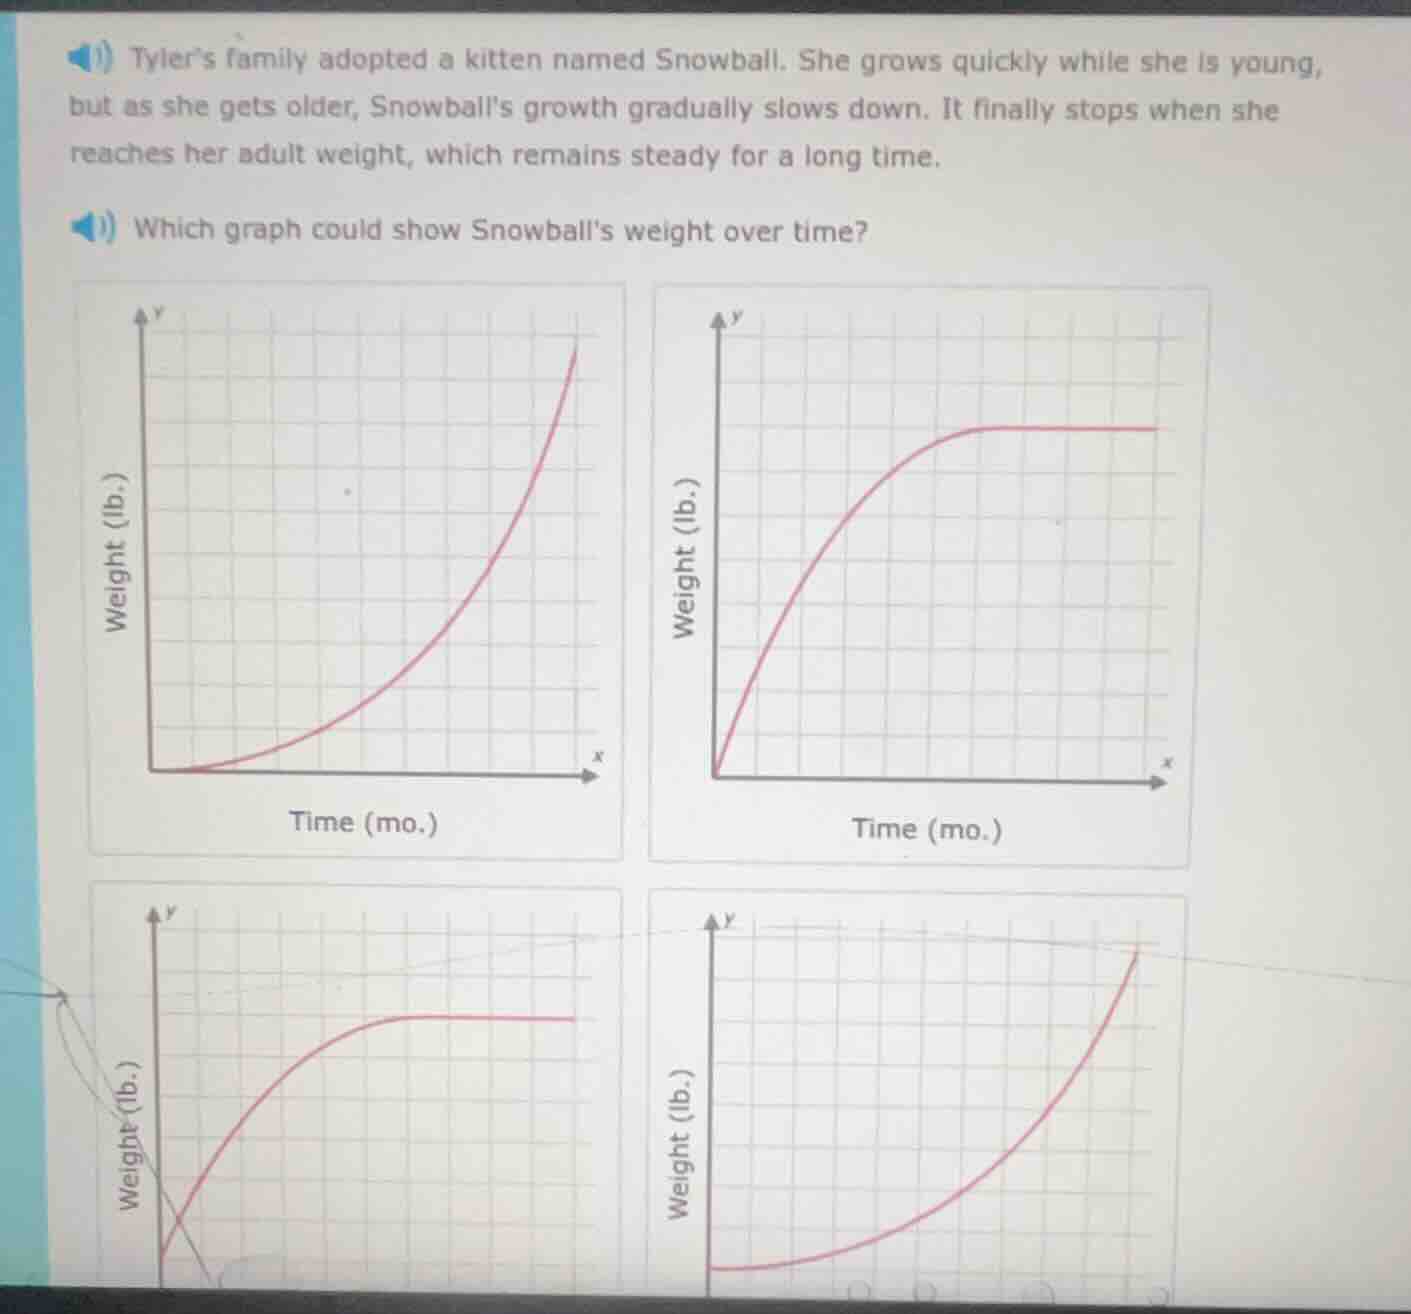
tyler’s family adopted a kitten named snowball. she grows quickly while she is young, but as she gets older, snowball’s growth gradually slows down. it finally stops when she reaches her adult weight, which remains steady for a long time. which graph could show snowball’s weight over time?
The graph needs to show: 1) Fast initial weight gain, 2) Slowing growth with age, 3) Weight becoming steady (flat line) at adult weight. The top-left and bottom-right graphs show accelerating/ongoing growth, which does not match. The bottom-left graph starts with weight above zero and has a crossing line, which is inconsistent with a kitten's starting weight and steady adult weight. The top-right graph has a steep initial curve (fast young growth), the curve flattens (slowing growth), and finally becomes horizontal (steady adult weight), matching the description.

Snap & solve any problem in the app
Get step-by-step solutions on Sovi AI
Photo-based solutions with guided steps
Explore more problems and detailed explanations
The top-right graph (with a curve that steeply rises, then flattens to a horizontal line)