QUESTION IMAGE
Question
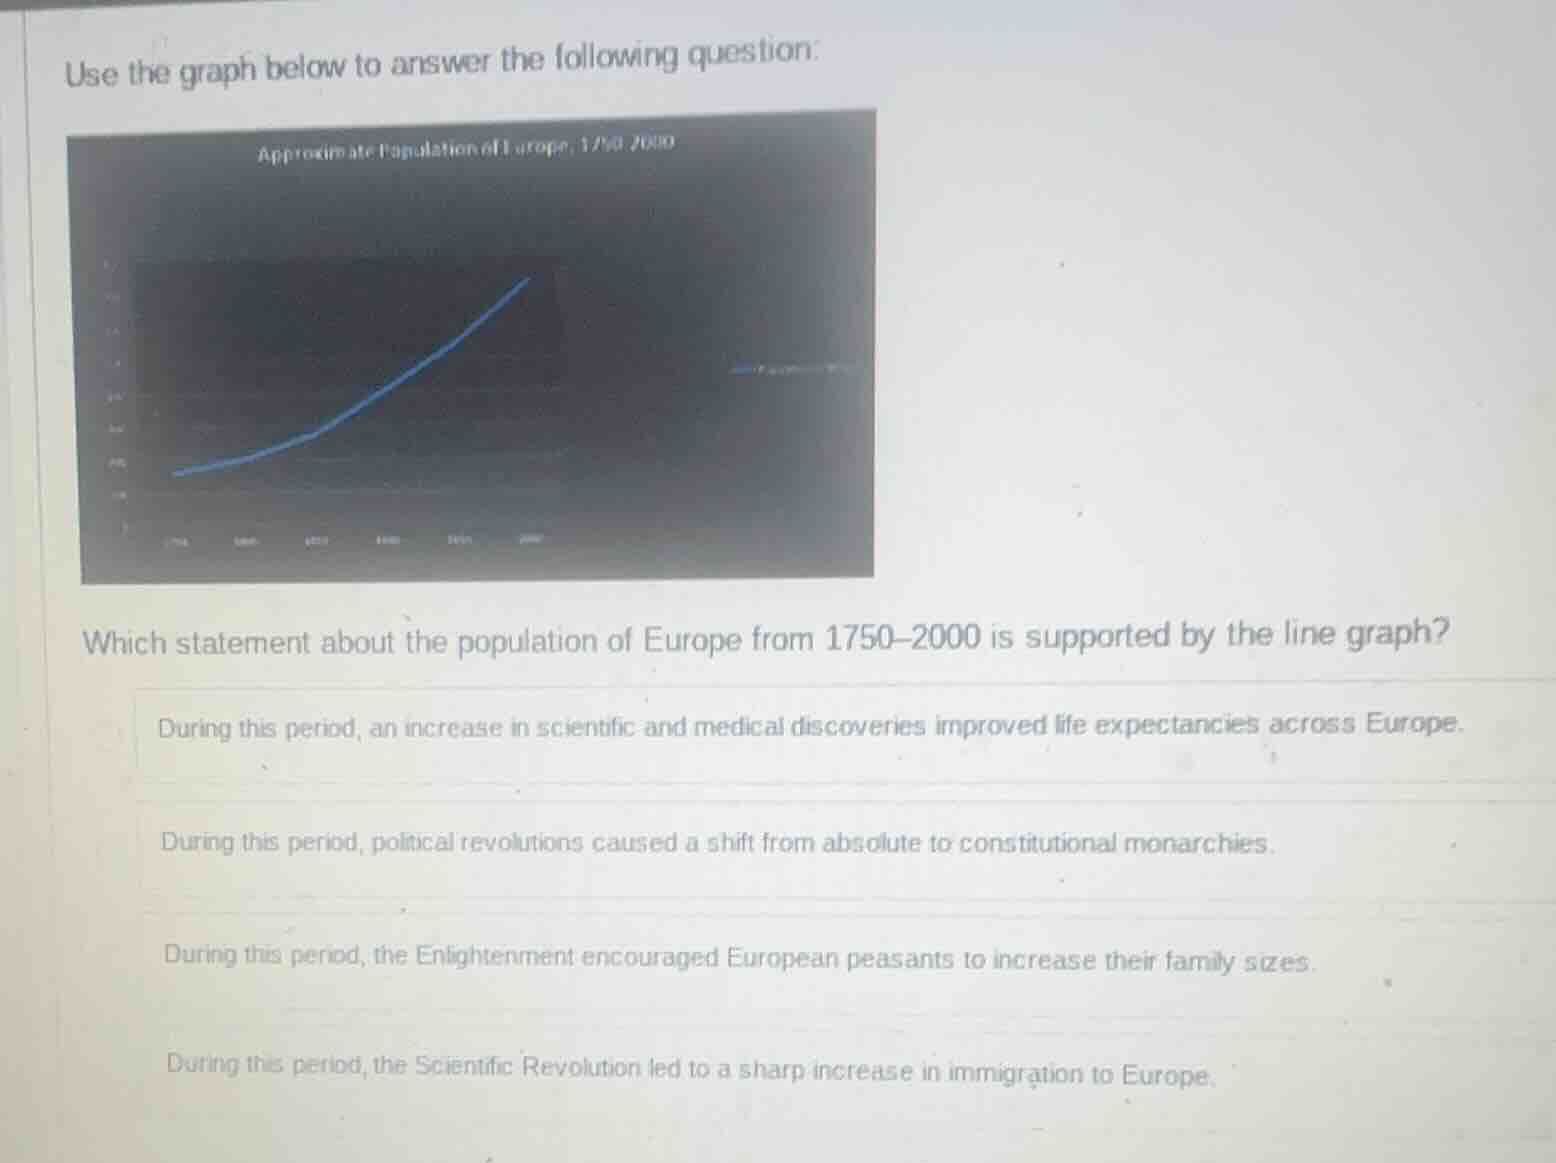
use the graph below to answer the following question:
approximate population of europe, 1750-2000
which statement about the population of europe from 1750-2000 is supported by the line graph?
during this period, an increase in scientific and medical discoveries improved life expectancies across europe.
during this period, political revolutions caused a shift from absolute to constitutional monarchies.
during this period, the enlightenment encouraged european peasants to increase their family sizes.
during this period, the scientific revolution led to a sharp increase in immigration to europe.
The line graph only shows a steady, sharp increase in Europe's population from 1750-2000. We need to identify which option directly relates to a factor that would cause population growth.
- Political revolutions changing monarchy types (second option) do not directly impact population numbers shown in the graph.
- The Enlightenment encouraging larger family sizes (third option) is not a direct, widely documented driver of this massive population growth, and the graph does not indicate family size changes.
- The Scientific Revolution (fourth option) occurred before 1750, so it cannot explain the 1750-2000 growth, and immigration is not shown in the graph.
- Improved scientific/medical discoveries increasing life expectancy (first option) directly leads to population growth, which aligns with the upward trend in the graph.

Snap & solve any problem in the app
Get step-by-step solutions on Sovi AI
Photo-based solutions with guided steps
Explore more problems and detailed explanations
During this period, an increase in scientific and medical discoveries improved life expectancies across Europe.