QUESTION IMAGE
Question
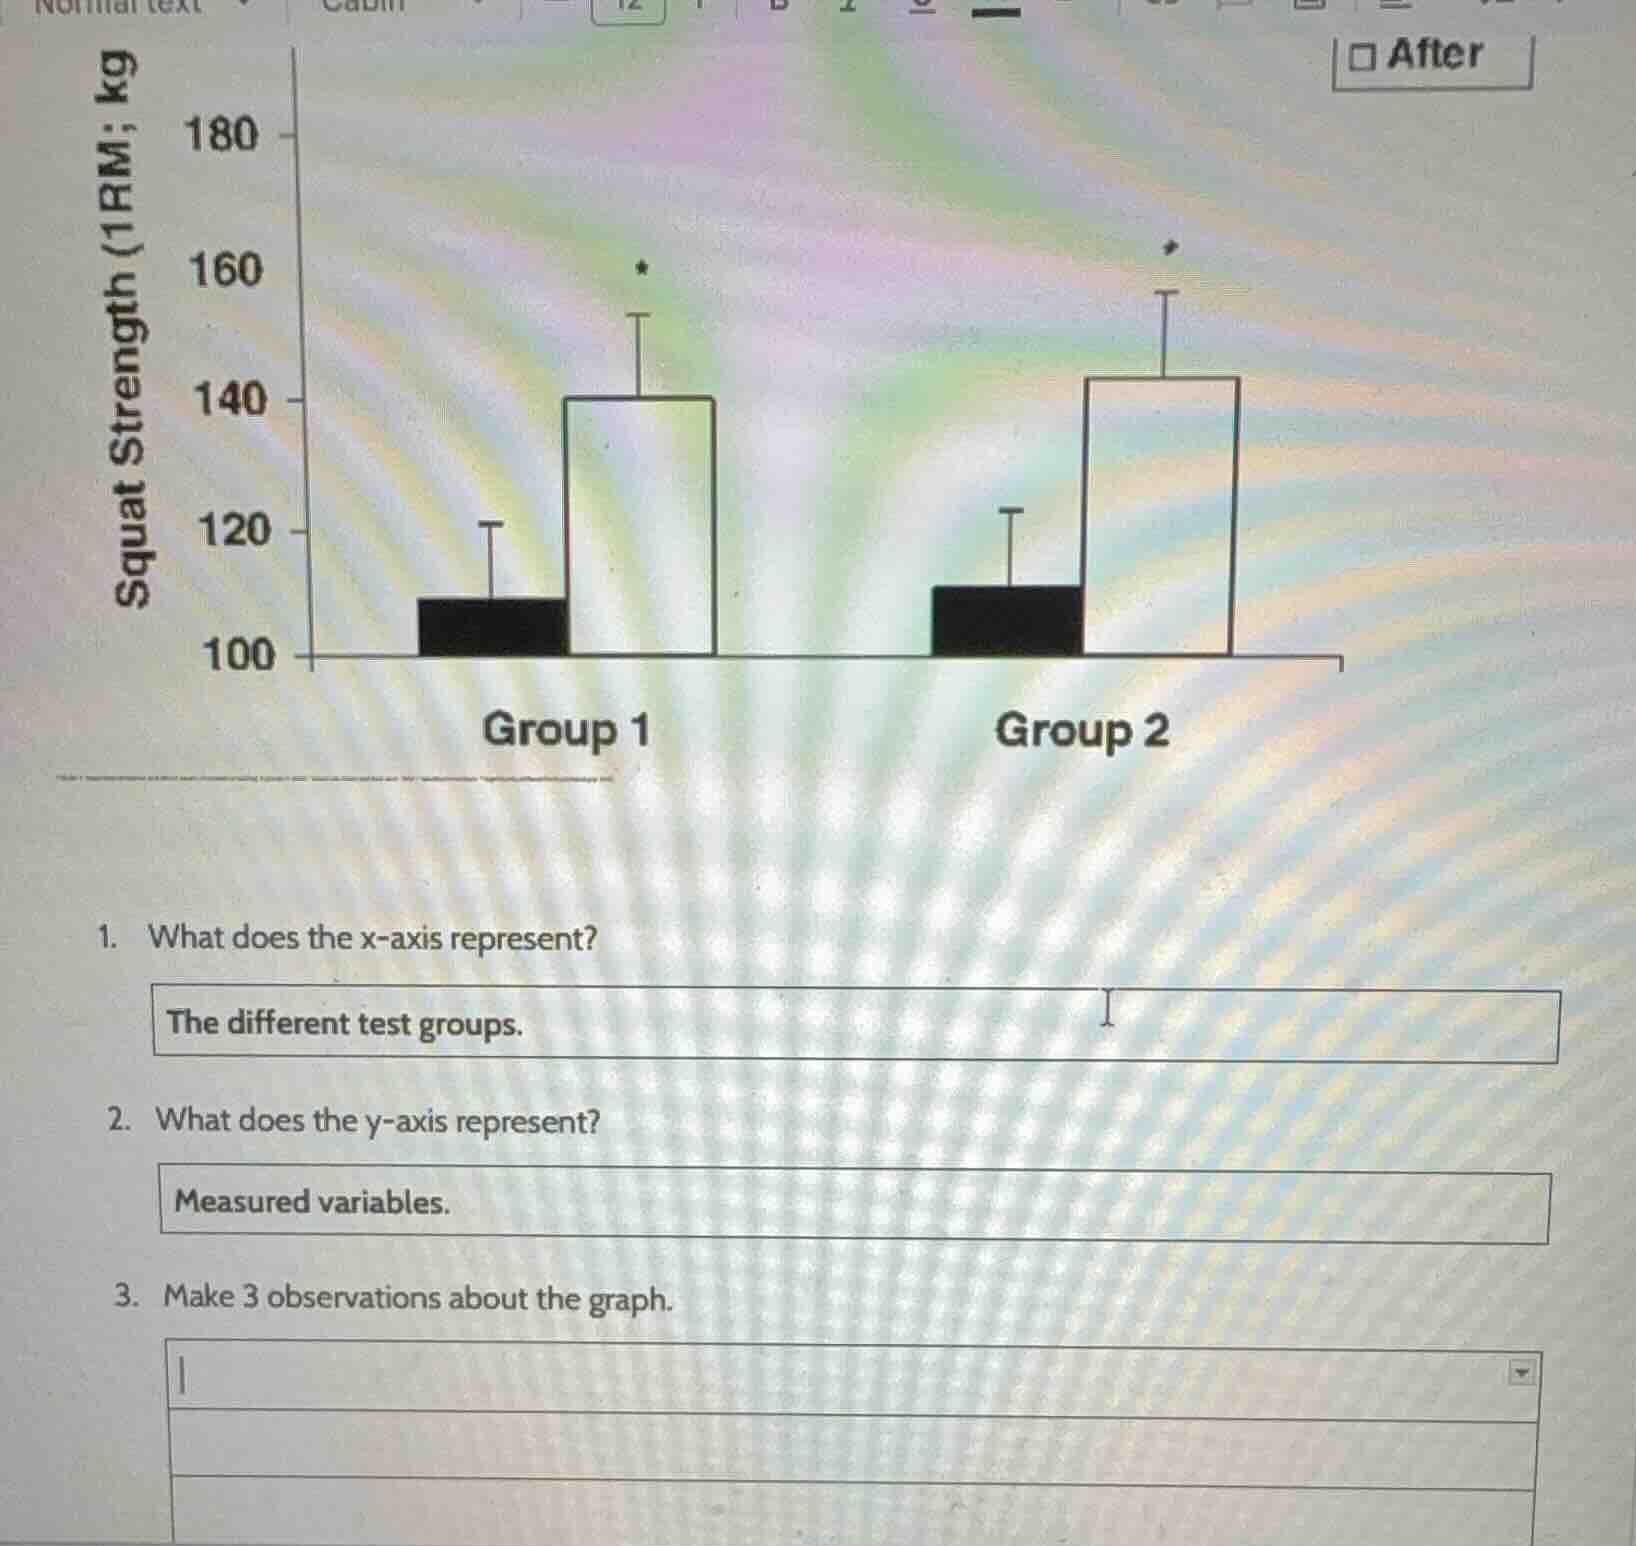
- what does the x - axis represent?
the different test groups.
- what does the y - axis represent?
measured variables.
- make 3 observations about the graph.

Snap & solve any problem in the app
Get step-by-step solutions on Sovi AI
Photo-based solutions with guided steps
Explore more problems and detailed explanations
- The different test groups (Group 1 and Group 2).
- Squat Strength (1RM; kg).
- Both groups showed a significant increase in squat strength after the intervention; Group 2 had a slightly higher final squat strength than Group 1; the initial squat strength for both groups was approximately 110 kg.