QUESTION IMAGE
Question
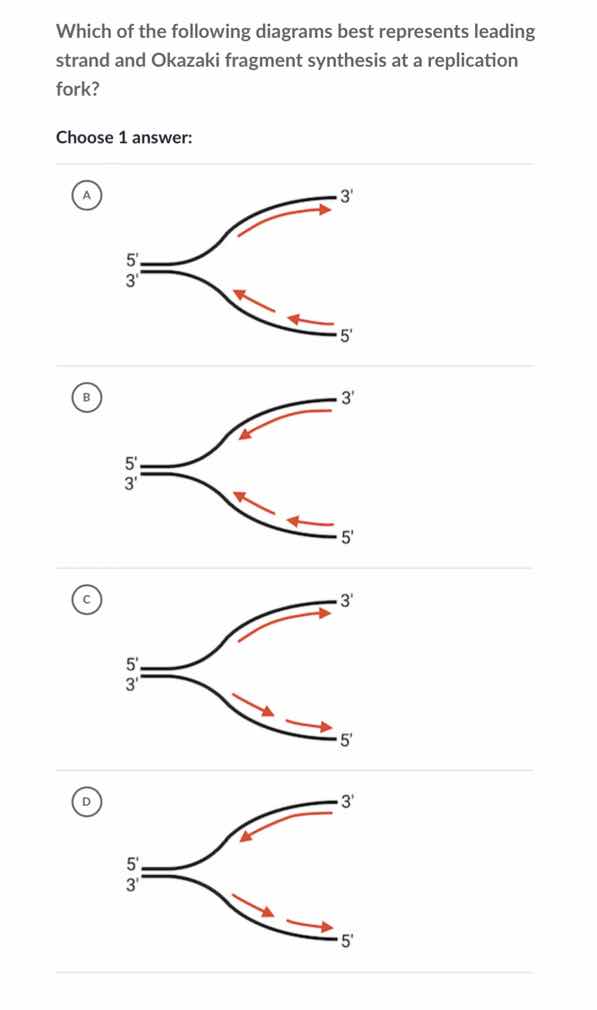
which of the following diagrams best represents leading strand and okazaki fragment synthesis at a replication fork? choose 1 answer: a diagram, b diagram, c diagram, d diagram
Brief Explanations
To determine the correct diagram, we recall DNA replication:
- The leading strand is synthesized continuously in the \( 5' \to 3' \) direction, following the replication fork.
- The lagging strand (with Okazaki fragments) is synthesized discontinuously as short fragments (Okazaki fragments) in the \( 5' \to 3' \) direction, but moving away from the replication fork (so the fragments are oriented \( 5' \to 3' \) and the overall lagging strand growth is opposite to the fork movement).
Analyzing the options:
- Option A: The leading strand (red) is \( 5' \to 3' \) (correct, following the fork), but the lagging strand fragments are \( 3' \to 5' \) (incorrect, DNA synthesis is \( 5' \to 3' \)).
- Option B: Both leading and lagging strand fragments are \( 3' \to 5' \) (incorrect, synthesis is \( 5' \to 3' \)).
- Option C: Leading strand (red) is \( 5' \to 3' \) (correct, following the fork). Lagging strand fragments are \( 5' \to 3' \) (correct direction) and oriented away from the fork (Okazaki fragments are synthesized in short \( 5' \to 3' \) segments, so the arrows for the lagging strand should be \( 5' \to 3' \) and moving away from the fork, which matches here).
- Option D: Leading strand is \( 3' \to 5' \) (incorrect, synthesis is \( 5' \to 3' \)).

Snap & solve any problem in the app
Get step-by-step solutions on Sovi AI
Photo-based solutions with guided steps
Explore more problems and detailed explanations
C. The diagram where the leading strand (red) is synthesized \( 5' \to 3' \) following the replication fork, and the lagging strand (with Okazaki fragments) is synthesized as \( 5' \to 3' \) fragments moving away from the fork.