QUESTION IMAGE
Question
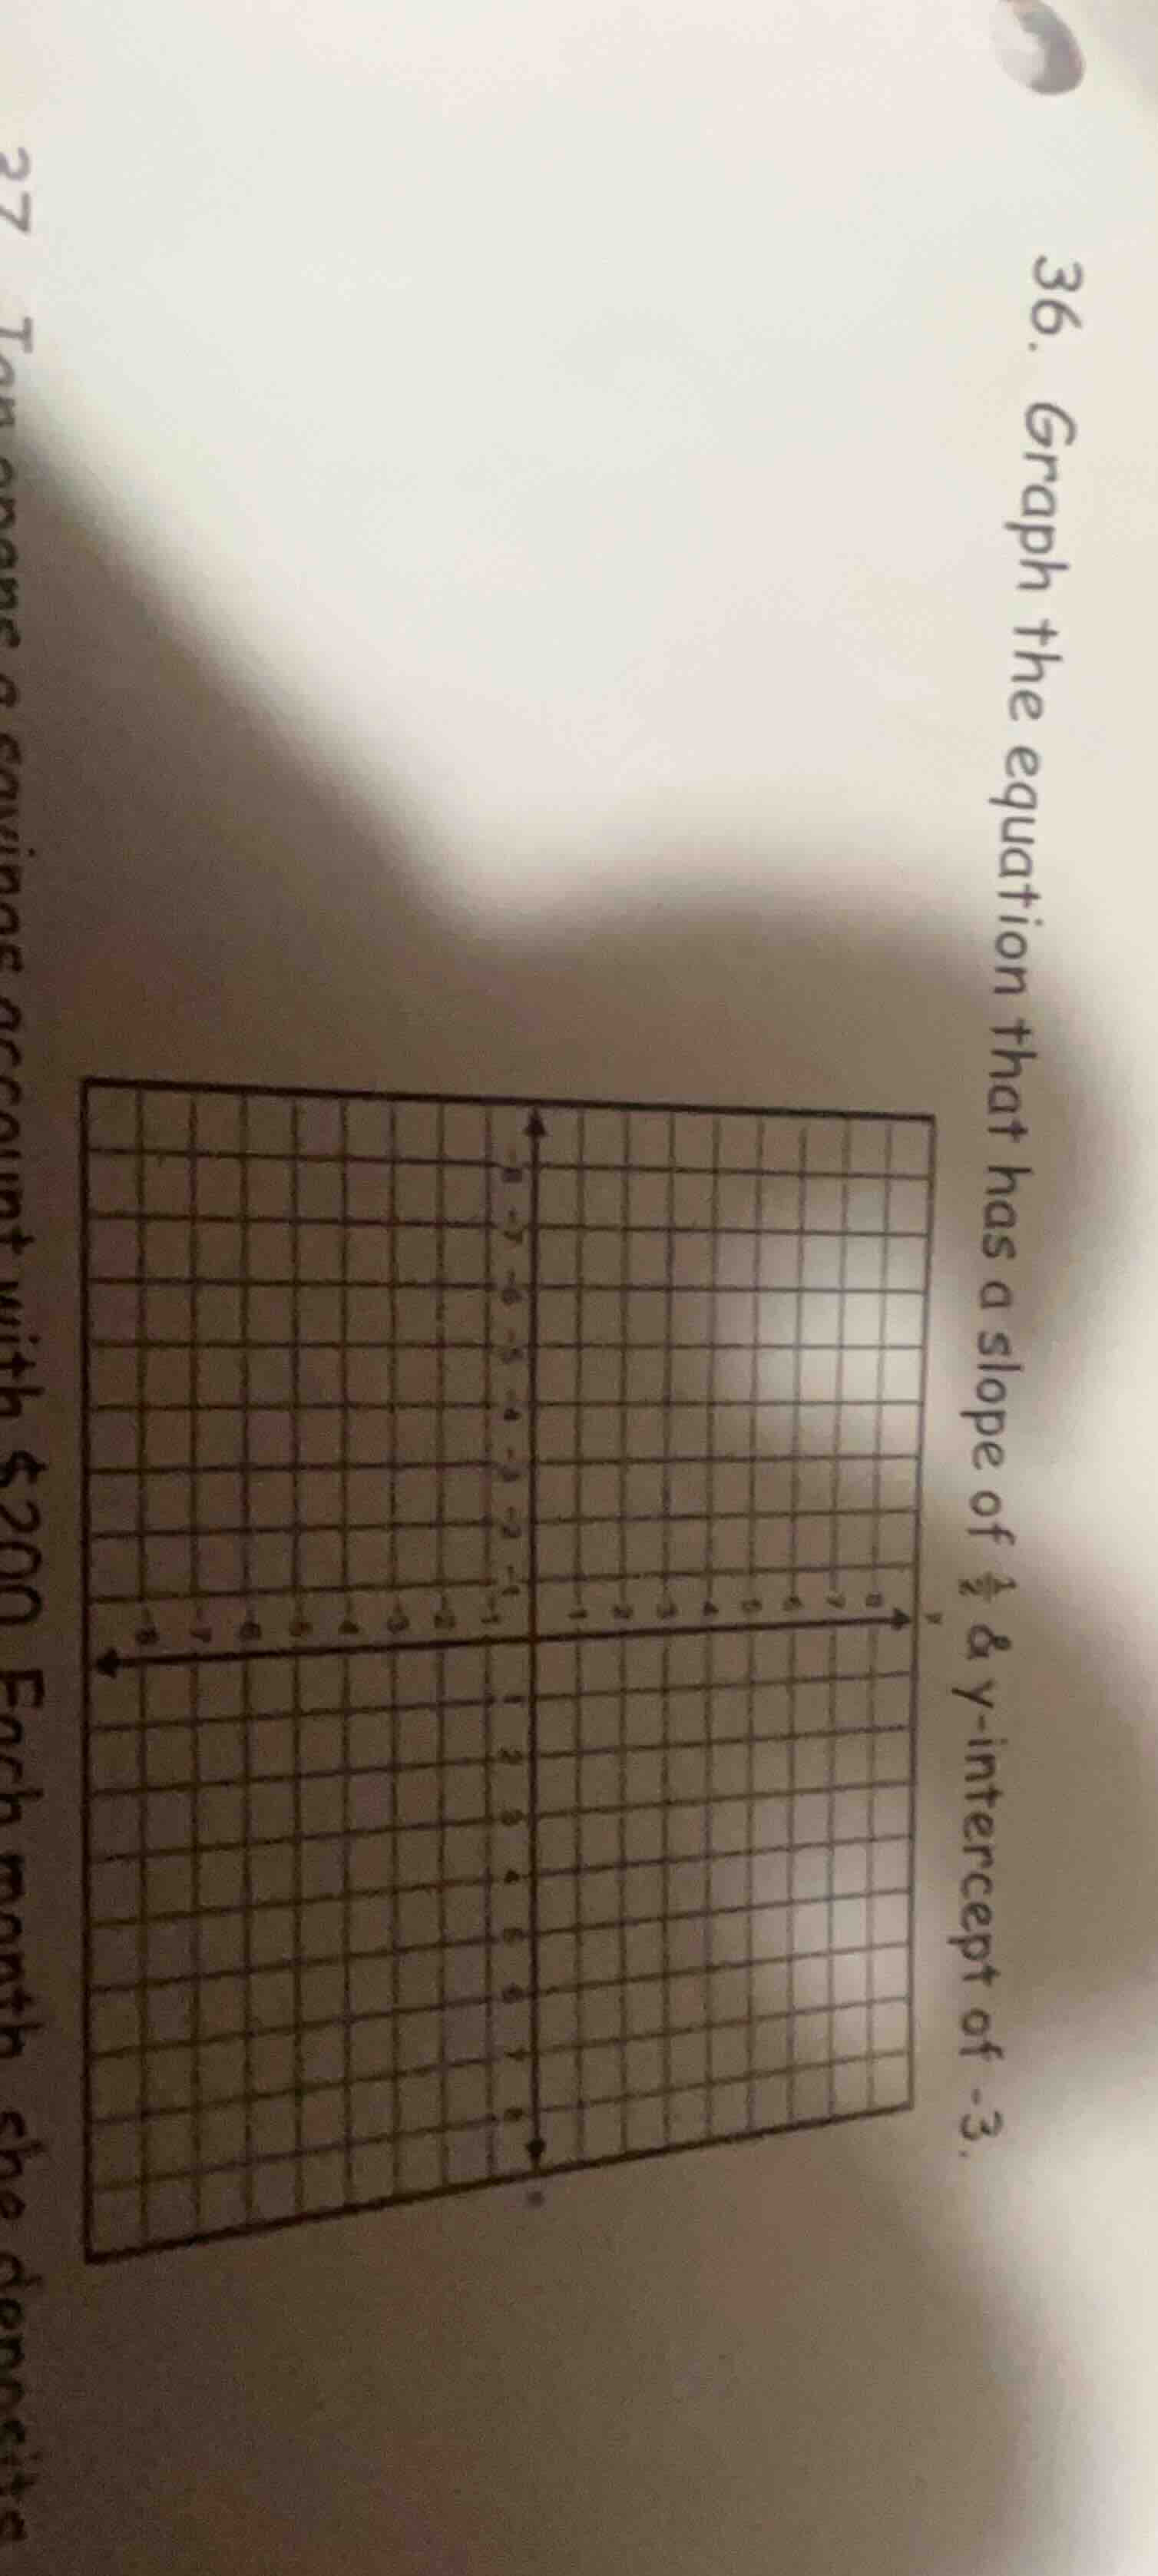
- graph the equation that has a slope of \\(\frac{1}{2}\\) & y-intercept of -3.
Step1: Recall slope - intercept form
The slope - intercept form of a linear equation is $y = mx + b$, where $m$ is the slope and $b$ is the y - intercept.
Given that the slope $m=\frac{1}{2}$ and the y - intercept $b = - 3$, the equation of the line is $y=\frac{1}{2}x-3$.
Step2: Plot the y - intercept
The y - intercept is $b=-3$, so we start by plotting the point $(0, - 3)$ on the coordinate plane. This is the point where the line crosses the y - axis.
Step3: Use the slope to find another point
The slope $m = \frac{1}{2}$ can be thought of as $\frac{\text{rise}}{\text{run}}=\frac{1}{2}$. From the point $(0,-3)$, we move up 1 unit (because the rise is 1) and then move to the right 2 units (because the run is 2). This gives us the point $(0 + 2,-3 + 1)=(2,-2)$. We can also move down 1 unit and left 2 units from $(0,-3)$ to get another point $(-2,-4)$ (since $\frac{- 1}{-2}=\frac{1}{2}$).
Step4: Draw the line
After plotting the points (at least two points, like $(0,-3)$ and $(2,-2)$ or more), we draw a straight line passing through these points. This line represents the graph of the equation $y=\frac{1}{2}x - 3$.

Snap & solve any problem in the app
Get step-by-step solutions on Sovi AI
Photo-based solutions with guided steps
Explore more problems and detailed explanations
The equation of the line is $y=\frac{1}{2}x-3$. To graph it, plot $(0, - 3)$ (y - intercept) and use the slope $\frac{1}{2}$ to find other points (e.g., $(2,-2)$) and draw a straight line through them.