QUESTION IMAGE
Question
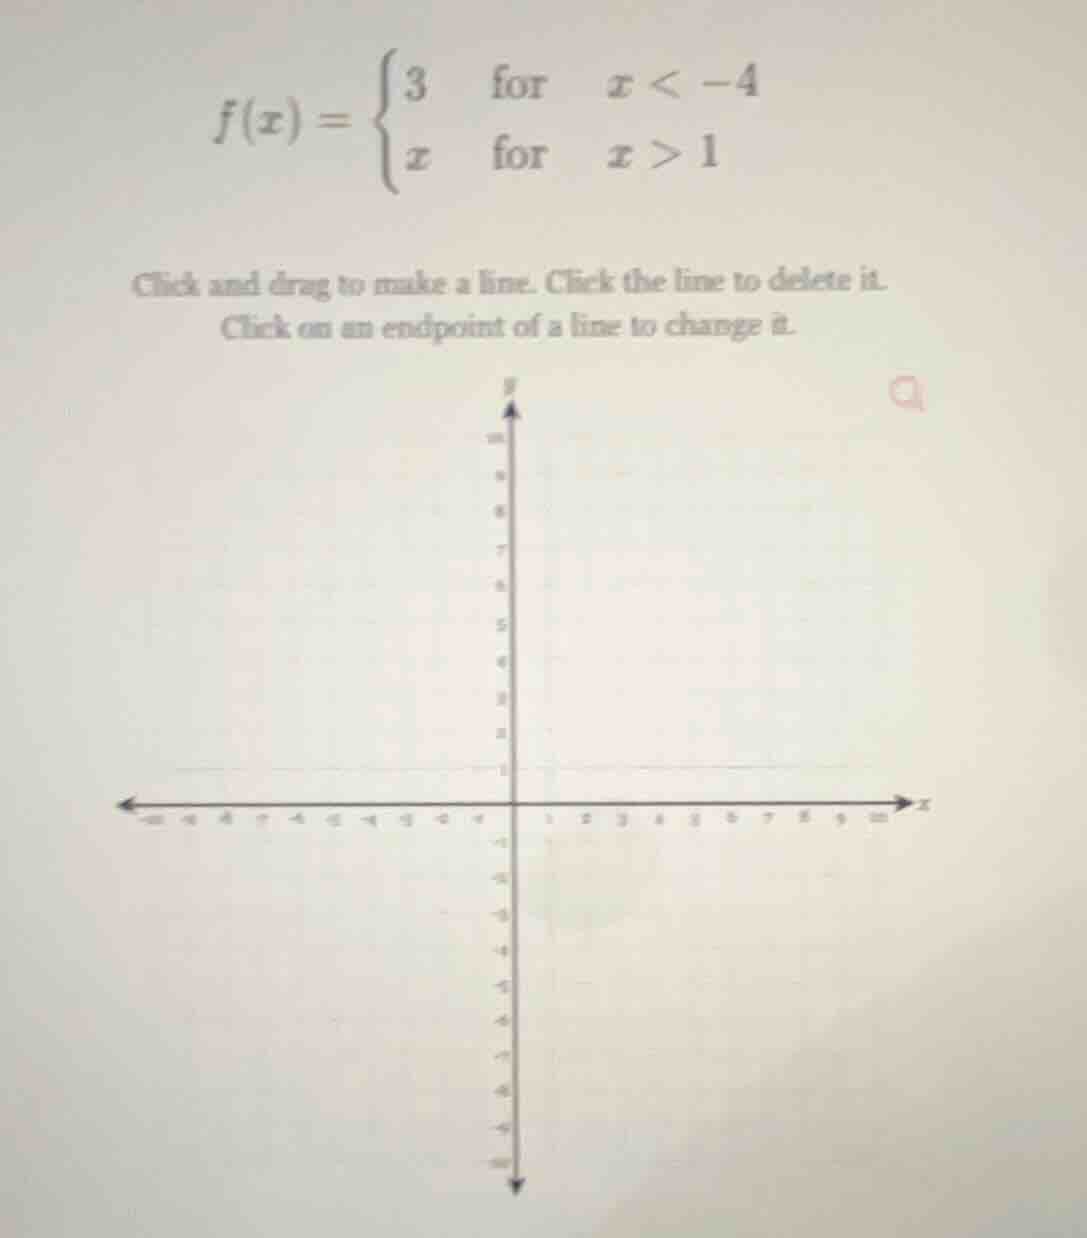
f(x) = \
click and drag to make a line. click the line to delete it. click on an endpoint of a line to change it.
Step1: Analyze the first piece
For \( x < -4 \), \( f(x) = 3 \). This is a horizontal line. We start from the left (as \( x \) approaches \( -\infty \)) and go up to \( x = -4 \), but since \( x < -4 \), the endpoint at \( x = -4 \) is an open circle. The \( y \)-value is 3, so we draw a horizontal line from the left (e.g., \( x = -10 \)) to \( x = -4 \) (open circle) at \( y = 3 \).
Step2: Analyze the second piece
For \( x > 1 \), \( f(x) = x \). This is a linear function with slope 1. We start at \( x = 1 \) (open circle, since \( x > 1 \)) and draw a line with slope 1. For example, when \( x = 1 \), \( f(1) \) is not defined here (open circle), but when \( x = 2 \), \( f(2) = 2 \); \( x = 3 \), \( f(3) = 3 \), etc. So we draw a line starting at \( (1, 1) \) (open circle) and going to the right with slope 1.
(Note: Since this is a graphing task, the key is to plot the two pieces correctly. The first piece is horizontal at \( y = 3 \) for \( x < -4 \), and the second piece is the line \( y = x \) for \( x > 1 \) with open circles at \( x = -4 \) (for the first piece) and \( x = 1 \) (for the second piece).)

Snap & solve any problem in the app
Get step-by-step solutions on Sovi AI
Photo-based solutions with guided steps
Explore more problems and detailed explanations
To graph the piecewise function:
- For \( \boldsymbol{x < -4} \): Draw a horizontal line at \( y = 3 \) from the left (e.g., \( x = -10 \)) to \( x = -4 \) (open circle at \( (-4, 3) \)).
- For \( \boldsymbol{x > 1} \): Draw a line with slope 1 starting at \( x = 1 \) (open circle at \( (1, 1) \)) and extending to the right (e.g., through \( (2, 2) \), \( (3, 3) \), etc.).