QUESTION IMAGE
Question
answer attempt 1 out of 5
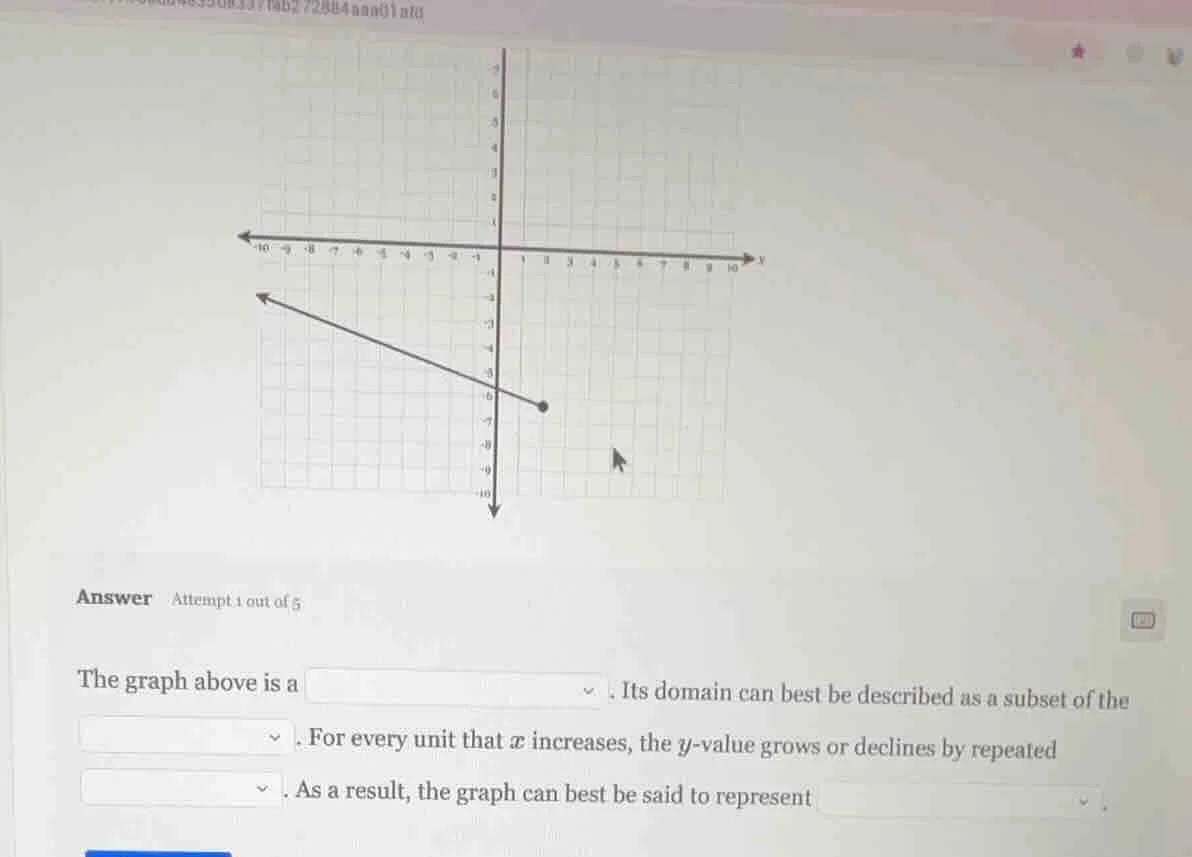
the graph above is a . its domain can best be described as a subset of the . for every unit that $x$ increases, the $y$-value grows or declines by repeated . as a result, the graph can best be said to represent .

Snap & solve any problem in the app
Get step-by-step solutions on Sovi AI
Photo-based solutions with guided steps
Explore more problems and detailed explanations
half-line (ray)
real numbers
addition or subtraction (a constant amount)
a linear function with a negative slope