QUESTION IMAGE
Question
apply it
use what you learned to solve these problems.
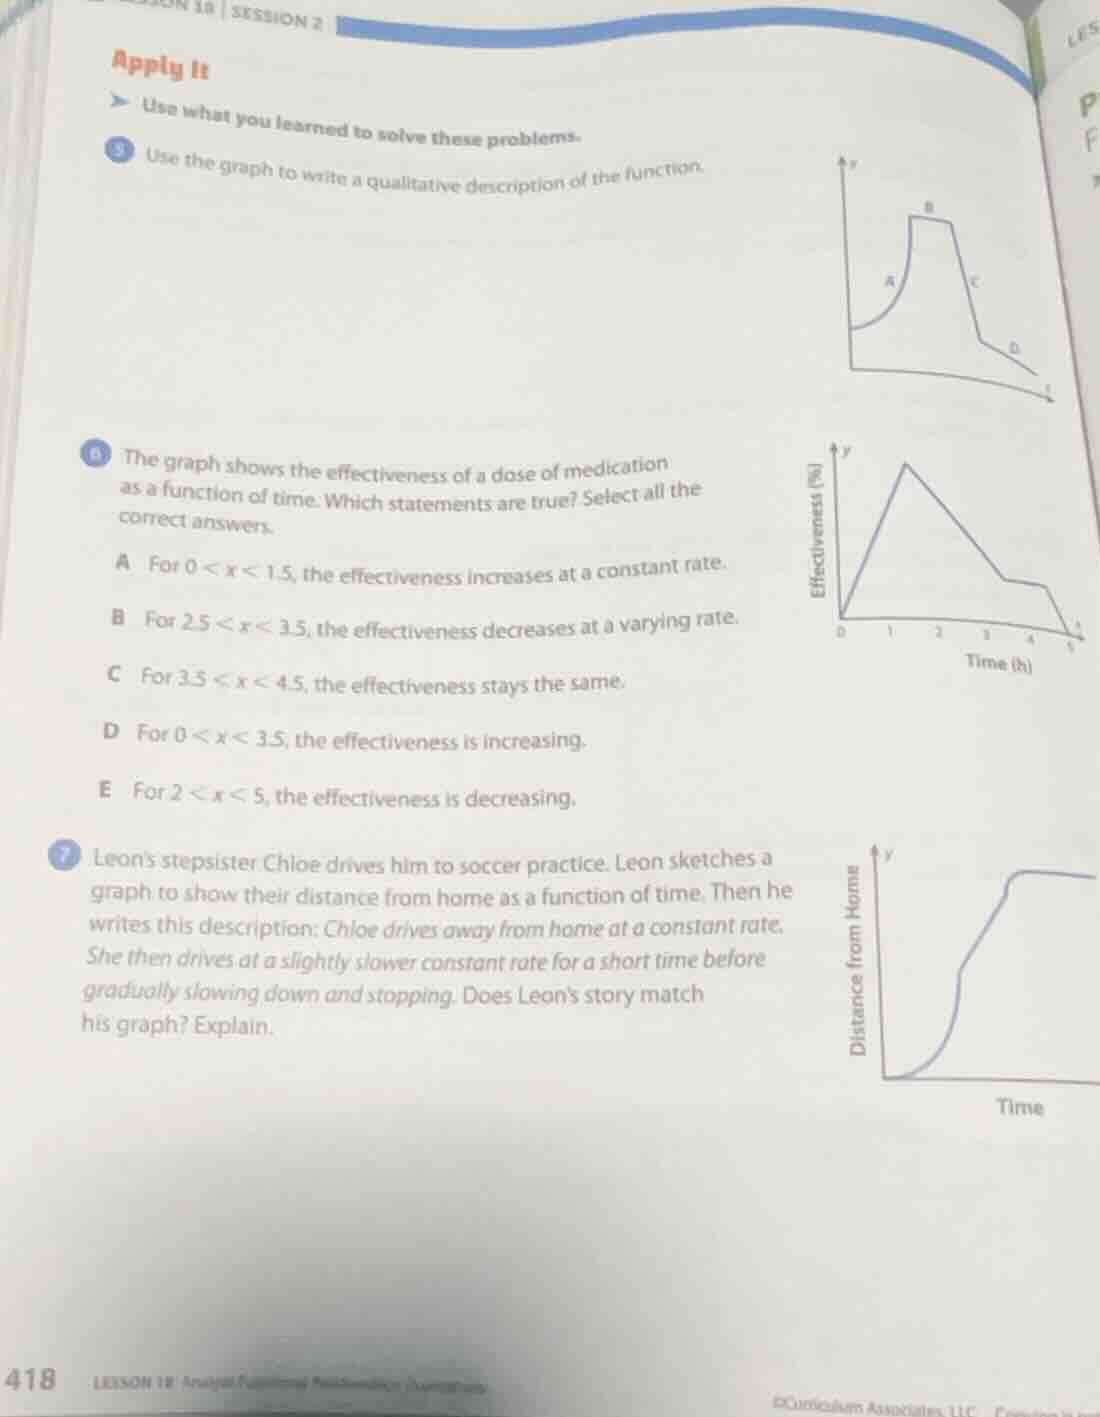
5 use the graph to write a qualitative description of the function.
6 the graph shows the effectiveness of a dose of medication as a function of time. which statements are true? select all the correct answers.
a for $0 < x < 1.5$, the effectiveness increases at a constant rate.
b for $2.5 < x < 3.5$, the effectiveness decreases at a varying rate.
c for $3.5 < x < 4.5$, the effectiveness stays the same.
d for $0 < x < 3.5$, the effectiveness is increasing.
e for $2 < x < 5$, the effectiveness is decreasing.
7 leons stepsister chloe drives him to soccer practice. leon sketches a graph to show their distance from home as a function of time. then he writes this description: chloe drives away from home at a constant rate. she then drives at a slightly slower constant rate for a short time before gradually slowing down and stopping. does leons story match his graph? explain.
Problem 5
- Segment A: The curve rises with an increasing slope, so the function is increasing at an increasing rate.
- Segment B: The line is horizontal, so the function remains constant (no change in value).
- Segment C: The line falls with a constant steep negative slope, so the function is decreasing at a constant rate.
- Segment D: The curve falls with a decreasing slope (becomes less steep), so the function is decreasing at a decreasing rate.
- A: The segment $0
- B: The segment $2.5
- C: The segment $3.5
- D: Effectiveness decreases after $x=1.5$, so it is not increasing for $0
- E: The segment $2
- B: The segment $2.5
- A constant driving rate corresponds to a straight, upward-sloping segment on a distance-time graph (constant slope = constant speed).
- The graph's first segment is a curve with increasing slope (speeding up), not a straight line.
- The graph's second segment is a less steep curve (still changing slope), not a straight line for a slower constant rate.
- The final segment is a straight upward line then flat, which does not match "gradually slowing down to stop" (which would be a curve with decreasing slope to flat).

Snap & solve any problem in the app
Get step-by-step solutions on Sovi AI
Photo-based solutions with guided steps
Explore more problems and detailed explanations
- Segment A: The function increases at an increasing rate.
- Segment B: The function stays constant.
- Segment C: The function decreases at a constant rate.
- Segment D: The function decreases at a decreasing rate.
---