QUESTION IMAGE
Question
exponential decay functions
analyzing exponential decay graphs
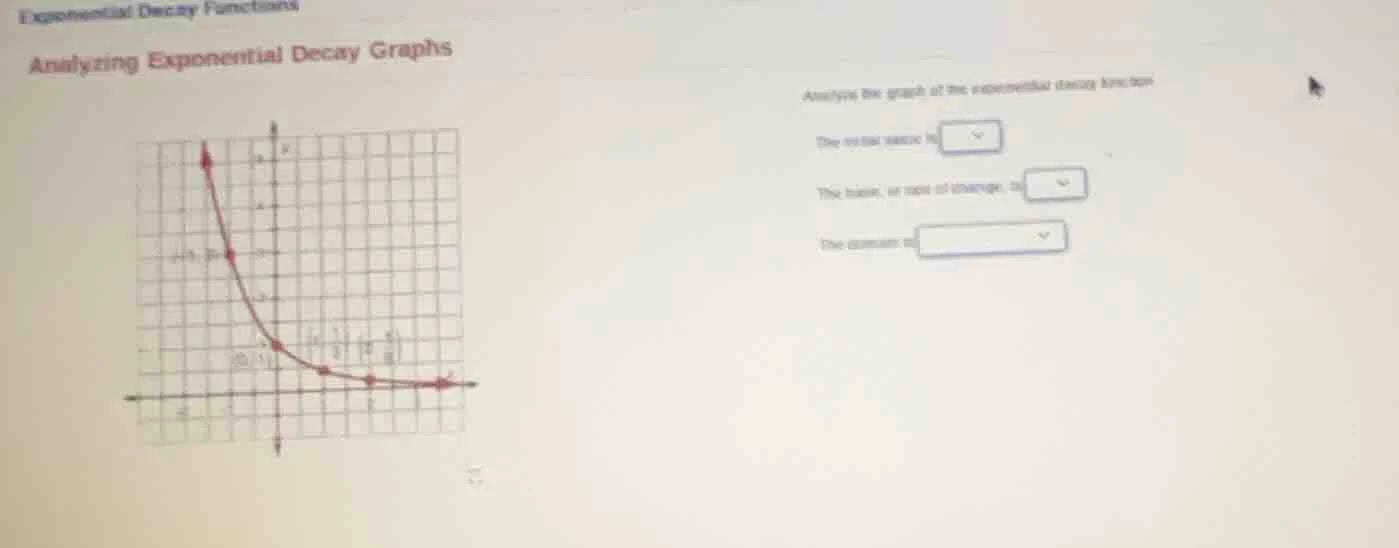
analyze the graph of the exponential decay function
the initial value is
the base, or rate of change, is
the domain is
Step1: Identify initial value
The initial value of an exponential function $f(x) = a(b)^x$ is the value at $x=0$, which is the y-intercept. From the graph, when $x=0$, $y=2$.
Step2: Determine decay base
Use a point $(x,y)$ on the graph, e.g., $(1,1)$. Substitute $a=2$, $x=1$, $y=1$ into $f(x)=a(b)^x$:
$1 = 2(b)^1$
Solve for $b$: $b = \frac{1}{2}$
Step3: State asymptote
Exponential decay functions of the form $f(x)=a(b)^x$ (where $0

Snap & solve any problem in the app
Get step-by-step solutions on Sovi AI
Photo-based solutions with guided steps
Explore more problems and detailed explanations
The initial value is 2
The base, or rate of change, is $\frac{1}{2}$
The asymptote is $y=0$