QUESTION IMAGE
Question
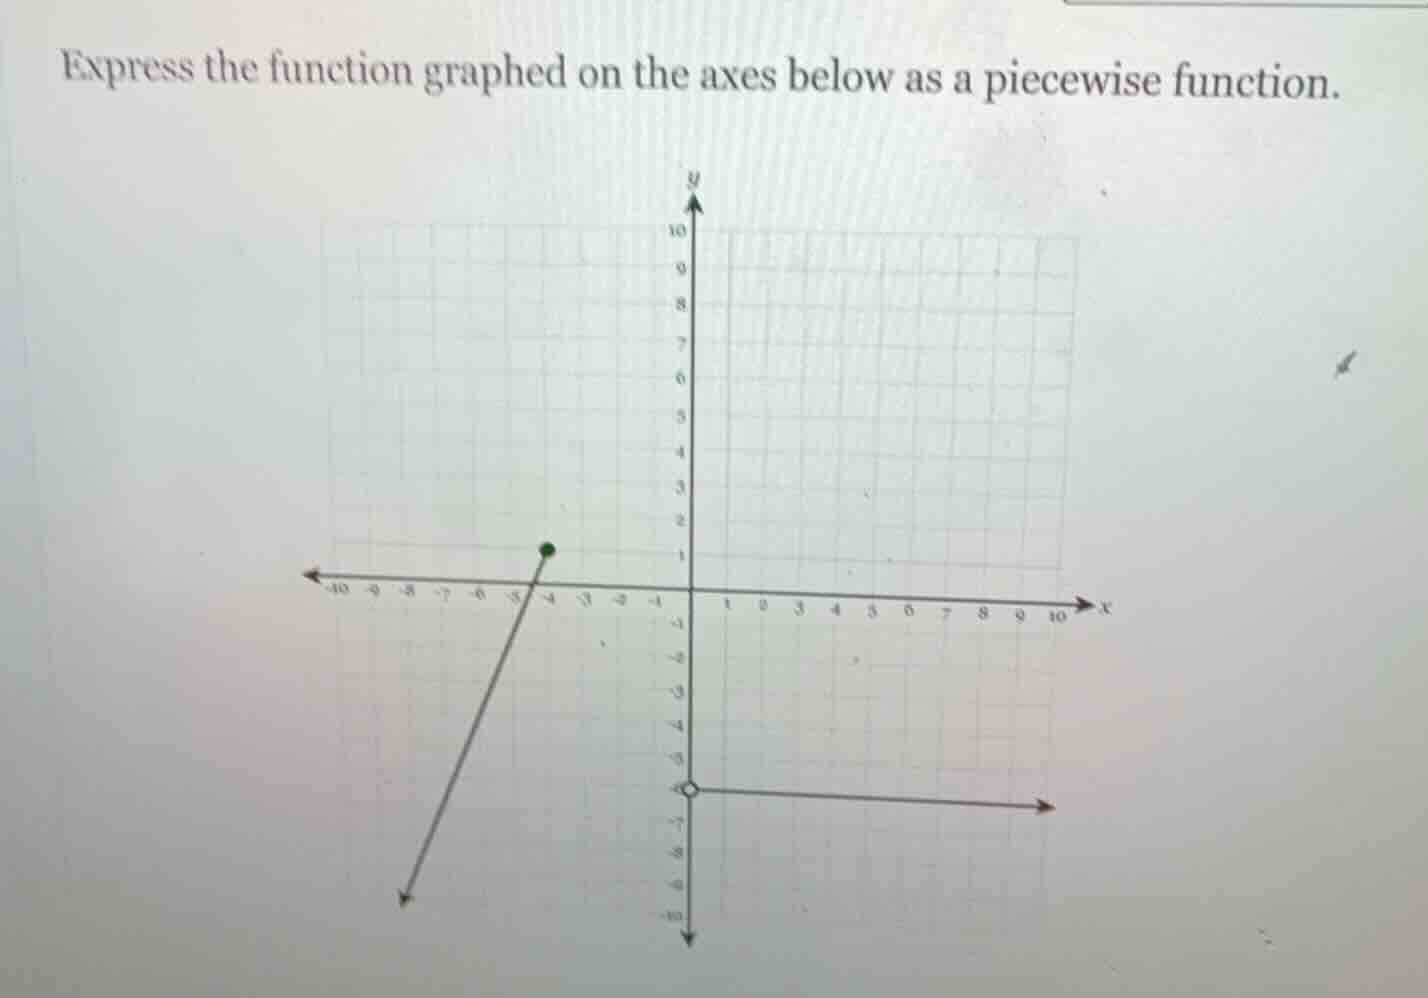
express the function graphed on the axes below as a piecewise function.
Step1: Analyze the left segment (x ≤ -4)
The left segment passes through (-4, 1) and let's find another point. From the graph, when x = -5, let's find y. The slope \( m = \frac{1 - y}{-4 - (-5)} \). Wait, actually, let's take two points: (-4, 1) and let's see the direction. Wait, the left line: when x = -4, y = 1; when x decreases, y decreases? Wait, no, looking at the graph, the left line goes from (-4, 1) down to the left. Wait, maybe I made a mistake. Wait, the green dot is at (-4, 1), and the line goes to the left and down. Let's find the slope. Let's take two points: (-4, 1) and, say, when x = -5, what's y? Wait, maybe the line has a slope. Let's calculate slope between (-4, 1) and another point. Wait, maybe the line is \( y = x + 5 \)? Wait, when x = -4, y = -4 + 5 = 1, which matches. When x = -5, y = -5 + 5 = 0? Wait, no, the graph at x = -5, is y 0? Wait, the x-axis is at y=0. Wait, maybe the left line is \( y = x + 5 \) for x ≤ -4. Let's check: when x = -4, y = -4 + 5 = 1 (matches the green dot). When x = -5, y = -5 + 5 = 0 (on the x-axis, which seems to match the graph).
Step2: Analyze the right segment (x > 0)
The right segment is a horizontal line at y = -6? Wait, no, the open circle is at (0, -6)? Wait, the graph shows an open circle at (0, -6) and a horizontal line to the right. So for x > 0, the function is y = -6.
Wait, wait, maybe I misread the y-axis. Wait, the y-axis: the numbers are 10,9,8,7,6,5,4,3,2,1,0,-1,-2,-3,-4,-5,-6,-7,-8,-9,-10. So the open circle is at (0, -6), and the horizontal line is y = -6 for x > 0.
And the left line: from (-4, 1) going to the left, with slope. Wait, let's re-examine. The left line: passes through (-4, 1) and let's see the direction. When x decreases by 1 (from -4 to -5), y decreases by 1? Wait, if x = -4, y = 1; x = -5, y = 0 (since it's on the x-axis). So slope is (0 - 1)/(-5 - (-4)) = (-1)/(-1) = 1. So the equation is y - 1 = 1*(x - (-4)) → y = x + 5. So for x ≤ -4, y = x + 5.
For the right part: at x = 0, open circle at y = -6, and horizontal line to the right, so y = -6 for x > 0.
Wait, but what about between x = -4 and x = 0? Is there a segment? Wait, the graph seems to have a gap between x = -4 and x = 0. So the function is piecewise:
- For x ≤ -4: y = x + 5
- For x > 0: y = -6
Wait, but let's confirm the right segment. The open circle is at (0, -6), so for x > 0, y = -6.
So putting it together:
\( f(x) =
\)
Wait, but is there a middle segment? The graph between x = -4 and x = 0: is it undefined? The problem says "the function graphed", so maybe there are two pieces: left (x ≤ -4) and right (x > 0), with a gap in between.

Snap & solve any problem in the app
Get step-by-step solutions on Sovi AI
Photo-based solutions with guided steps
Explore more problems and detailed explanations
\( f(x) =
\)