Step1: Recall properties of even functions
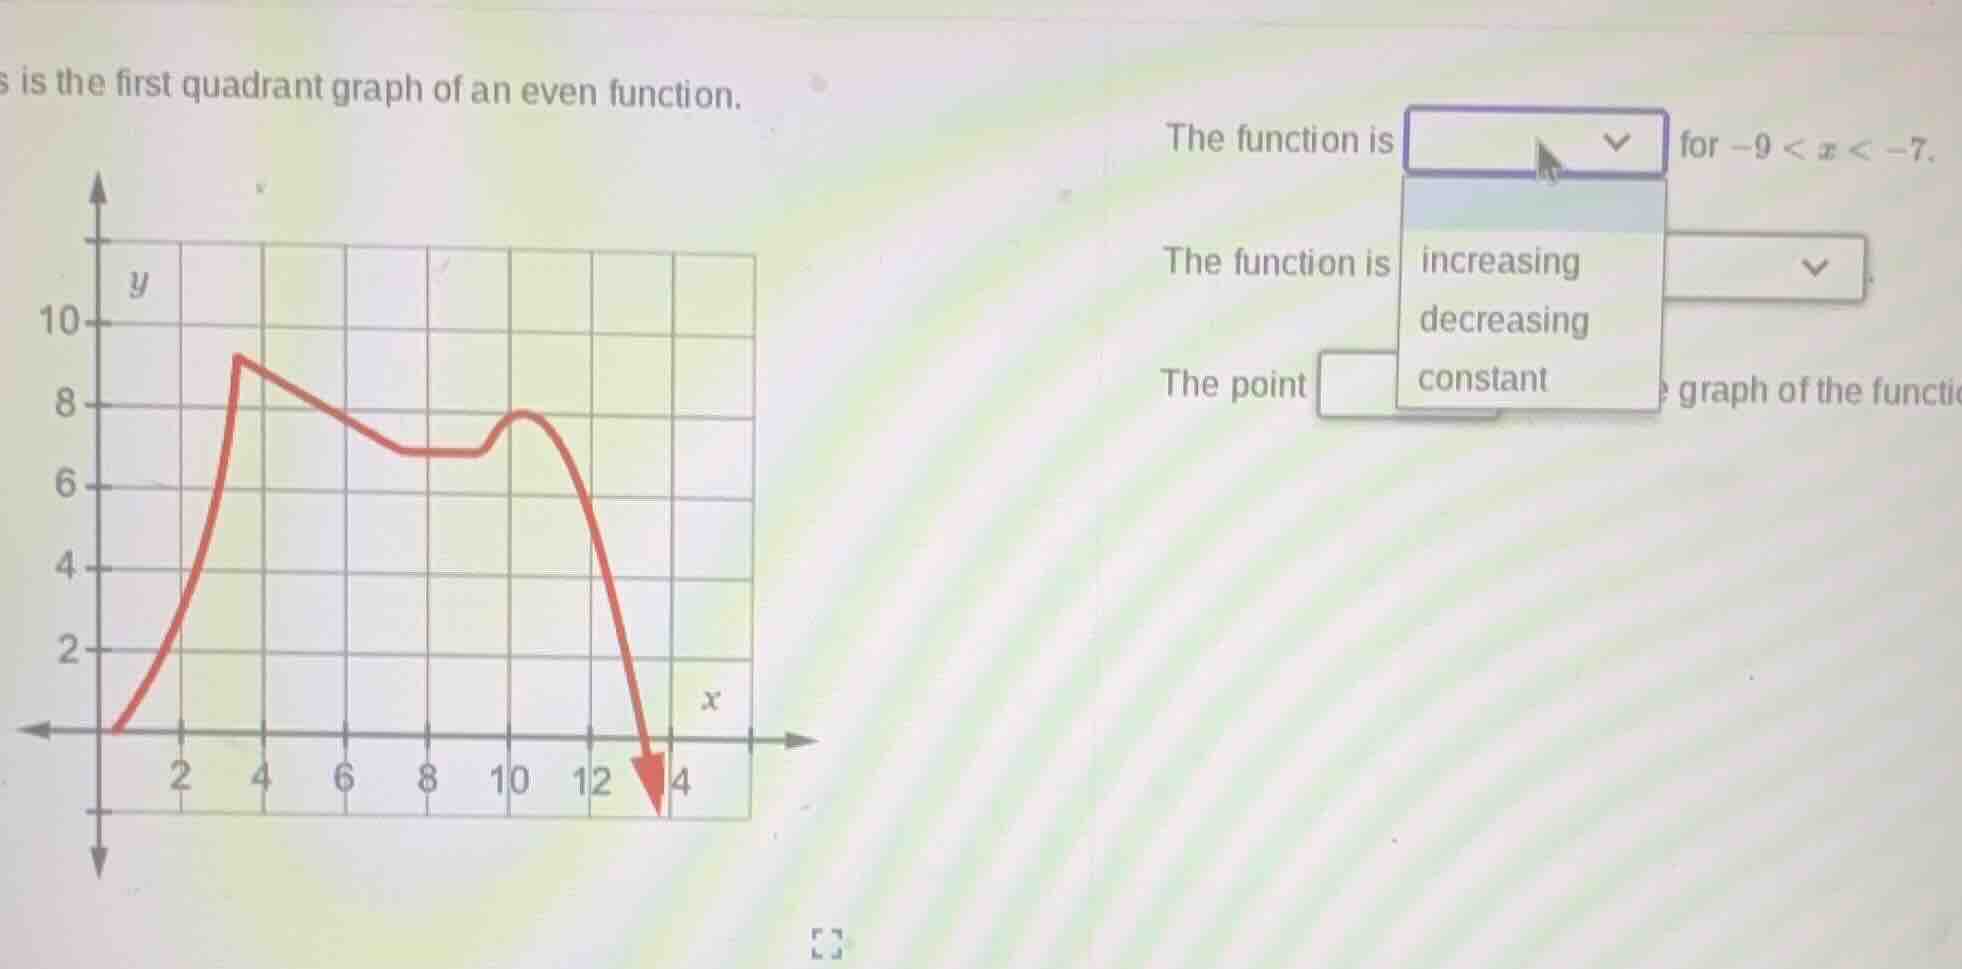
Even functions satisfy \( f(-x) = f(x) \), so their graphs are symmetric about the y - axis. This means that the behavior of the function for \( x>0 \) is mirrored for \( x < 0 \) (and vice - versa).
Step2: Analyze the graph in the first quadrant (x > 0) for the interval 7 < x < 9
Looking at the given graph in the first quadrant, for the interval \( 70 \) across the y - axis. So if we look at the graph in the first quadrant (x > 0), for \( 0 < x<4 \), the function is increasing (since as x increases from 0 to 4, y increases from 0 to 9). So the mirror image for \( - 40 \), when \( x \) is in \( 0 < x<4 \), the function is increasing (slope \( f'(x)>0 \)). So at \( x=-a \) where \( a\in(0,4) \), \( f'(-a)=-f'(a)<0 \)? Wait, no, that contradicts. Wait, no, if \( f(x) \) is even, \( f(-x)=f(x) \). Then \( f'(-x)\times(-1)=f'(x)\implies f'(-x)=-f'(x) \). So if \( f'(x)>0 \) for \( x\in(0,4) \), then \( f'(-x)=-f'(x)<0 \) for \( x\in(0,4) \) (i.e., \( -x\in(-4,0) \)). But we need to look at \( -9 < x<-7 \). Let's check the x - values. The graph in the first quadrant: from \( x = 0 \) to \( x = 4 \), increasing (slope positive). From \( x = 4 \) to \( x = 8 \), decreasing (slope negative). From \( x = 8 \) to \( x = 10 \), constant (slope zero), then decreasing. Now, the interval \( -9 < x<-7 \): the symmetric interval in \( x>0 \) is \( 7 < x<9 \). Looking at the graph, when \( x \) is in \( 0 < x<4 \), the function is increasing (slope positive). The interval \( -9 < x<-7 \): let's see the length. Wait, maybe I made a mistake in the symmetric interval. Wait, \( x=-9 \) and \( x = 9 \) are symmetric, \( x=-7 \) and \( x = 7 \) are symmetric. So the interval \( -9 < x<-7 \) is symmetric to \( 7 < x<9 \). Now, looking at the graph, when \( x \) is in \( 0 < x<4 \), the function is increasing (as \( x \) increases, \( y \) increases). So the slope at \( x\in(0,4) \) is positive. Then, for \( x\in(7,9) \), what's the slope? Wait, the graph from \( x = 4 \) to \( x = 8 \) is decreasing (slope negative), from \( x = 8 \) to \( x = 10 \) is constant (slope zero), then decreasing. Wait, maybe the interval \( -9 < x<-7 \) is symmetric to \( 7 < x<9 \), but the part of the graph from \( x = 0 \) to \( x = 4 \) is increasing. So the mirror image (for \( x < 0 \)) of the increasing part (0,4) in \( x>0 \) is (- 4,0) in \( x < 0 \). But we need to look at (-9,-7). Wait, maybe the x - axis scaling: the grid lines. Let's assume each grid square is 2 units? Wait, no, the x - axis has marks at 2,4,6,8,10,12,14. Wait, the first quadrant graph: when x is 0, y is 0; x = 2, y is 4; x = 4, y is 9; x = 6, y is 8; x = 8, y is 7; x = 10, y is 8; x = 12, y is 0? Wait, no, the graph: from (0,0) up to (4,9), then down to (8,7), then constant to (10,7), then up to (11,8), then down to (14,0). Wait, maybe my initial analysis was wrong. Let's re - examine. The function is even, so \( f(-x)=f(x) \). So the graph for \( x < 0 \) is the reflection of \( x>0 \) over the y - axis. So if in \( x>0 \), the function is increasing on \( (0,4) \) (since as x increases from 0 to 4, y increases), then in \( x < 0 \), the function will be increasing on \( (-4,0) \) (because reflection over y - axis: the slope of the tangent at \( x=-a \) (where \( a\in(0,4) \)) is the same as the slope at \( x = a \) but with the x - direction reversed? Wait, no. Wait, when you reflect a graph over the y - axis, the transformation is \( (x,y)\to(-x,y) \). So the derivative of \( y = f(-x) \) with respect to x is \( -f'(-x) \). But since \( f(-x)=f(x) \), then \( \frac{d}{dx}f(-x)=f'(x)=-f'(-x) \), so \( f'(-x)=-f'(x) \). So if \( f'(x)>0 \) for \( x\in(0,4) \), then \( f'(-x)=-f'(x)<0 \) for \( x\in(0,4) \) (i.e., \( -x\in(-4,0) \)). But we need to look at \( -9 < x<-7 \). Let's consider the x - values: \( -9 \) and \( -7 \) are to the left of \( - 4 \). So the interval \( -9 < x<-7 \) is symmetric to \( 7 < x<9 \) in \( x>0 \). In \( x>0 \), on \( (7,9) \), what's the behavior? From x = 8 to x = 10, the function is constant (y = 7), then from x = 10 to x = 14, it's decreasing. Wait, x = 7: let's see the y - value. At x = 7, the y - value should be equal to f(7)=f(-7). At x = 9, f(9)=f(-9). From the graph, at x = 4, y = 9; x = 8, y = 7; x = 10, y = 8; x = 12, y = 0. Wait, maybe the interval \( -9 < x<-7 \): since the function is even, the graph from \( x=-9 \) to \( x=-7 \) is the reflection of \( x = 7 \) to \( x = 9 \). Looking at the graph from \( x = 7 \) to \( x = 9 \): at x = 7, y = f(7)=f(-7); at x = 9, y = f(9)=f(-9). From the graph, when x is in \( 0 < x<4 \), the function is increasing (slope positive). The interval \( -9 < x<-7 \): let's think about the direction. If in \( x>0 \), the function is increasing on \( (0,4) \), then in \( x < 0 \), the function will be increasing on \( (-4,0) \) (because reflection over y - axis: the left - hand side of the y - axis, the increasing part of the right - hand side becomes increasing on the left - hand side? Wait, no, let's take a point. At x = 2 (in \( 0 < x<4 \)), y = 4; at x = 3, y = 7; at x = 4, y = 9. So in \( 0 < x<4 \), as x increases, y increases. So the reflection over y - axis: at x=-2, y = 4; x=-3, y = 7; x=-4, y = 9. So in \( -4 < x<0 \), as x increases (from - 4 to 0), y decreases? Wait, no, x=-4 is less than x=-3 (since -4 < - 3). Wait, when x increases from - 4 to - 3 (moving from left to right on the x - axis), y decreases from 9 to 7. So in \( -4 < x<0 \), the function is decreasing (as x increases, y decreases). But we need to look at \( -9 < x<-7 \). Let's see the x - values: -9 is less than -7. So as x increases from -9 to -7 (moving from left to right on the x - axis), what's the trend? Since the function is even, the graph from -9 to -7 is the reflection of 7 to 9. In 7 to 9: at x = 7, y = f(7); x = 8, y = f(8)=7; x = 9, y = f(9). From the graph, at x = 4, y = 9; x = 8, y = 7; x = 10, y = 8. Wait, maybe the function is increasing on \( -9 < x<-7 \). Wait, no, let's use the definition of increasing/decreasing: a function is increasing on an interval if for any \( x_1|x_2| \) (since \( x_1-x_2\implies|x_1|>|x_2| \)). Now, looking at the graph for \( x>0 \), when \( x \) is in \( 7 < x<9 \) (since \( |x_1|,|x_2|\in(7,9) \)), what's the trend of \( f(x) \) as \( x \) increases? From the graph, when \( x \) is in \( 0 < x<4 \), \( f(x) \) increases as \( x \) increases. When \( x \) is in \( 4 < x<8 \), \( f(x) \) decreases as \( x \) increases. When \( x \) is in \( 8 < x<10 \), \( f(x) \) is constant. When \( x \) is in \( 10 < x<14 \), \( f(x) \) decreases as \( x \) increases. Now, for \( x\in(7,9) \), \( x \) is in \( 4 < x<8 \) (since 7 and 9 are between 4 and 8? No, 7 is between 4 and 8, 9 is between 8 and 14. Wait, 7 < 8 < 9. So for \( x\in(7,8) \), \( x\in(4,8) \), so \( f(x) \) decreases as \( x \) increases (since in \( 4 < x<8 \), \( f(x) \) decreases). For \( x\in(8,9) \), \( x\in(8,14) \), \( f(x) \) decreases as \( x \) increases (after x = 10, it decreases, but at x = 8, it's 7, x = 10, it's 8? Wait, no, the graph: from (4,9) down to (8,7), then constant to (10,7), then up to (11,8), then down to (14,0). Oh! I see, I made a mistake earlier. From x = 8 to x = 10, the function is constant at y = 7? No, at x = 8, y = 7; x = 10, y = 8. So it's increasing from x = 8 to x = 10. Then from x = 10 to x = 14, it's decreasing. So for \( x\in(7,8) \): x from 7 to 8, y from f(7) to f(8). If f(7) is, say, at x = 7, let's see the graph: at x = 4, y = 9; x = 6, y = 8; x = 8, y = 7. So from x = 4 to x = 8, y decreases. So f(7) is between f(6)=8 and f(8)=7, so f(7) is 8 (since at x = 6, y = 8; x = 8, y = 7, so x = 7, y = 7.5? No, the graph: from (4,9) to (8,7), it's a straight line? Let's calculate the slope: \( m=\frac{7 - 9}{8 - 4}=\frac{-2}{4}=-0.5 \). So the equation from x = 4 to x = 8 is \( y-9=-0.5(x - 4) \), so \( y=-0.5x + 2+9=-0.5x + 11 \). At x = 7, \( y=-0.5\times7 + 11=-3.5 + 11 = 7.5 \). At x = 8, \( y = 7 \). Then from x = 8 to x = 10, the graph goes from (8,7) to (10,8), so the slope is \( \frac{8 - 7}{10 - 8}=\frac{1}{2}=0.5 \), so it's increasing. Then from x = 10 to x