QUESTION IMAGE
Question
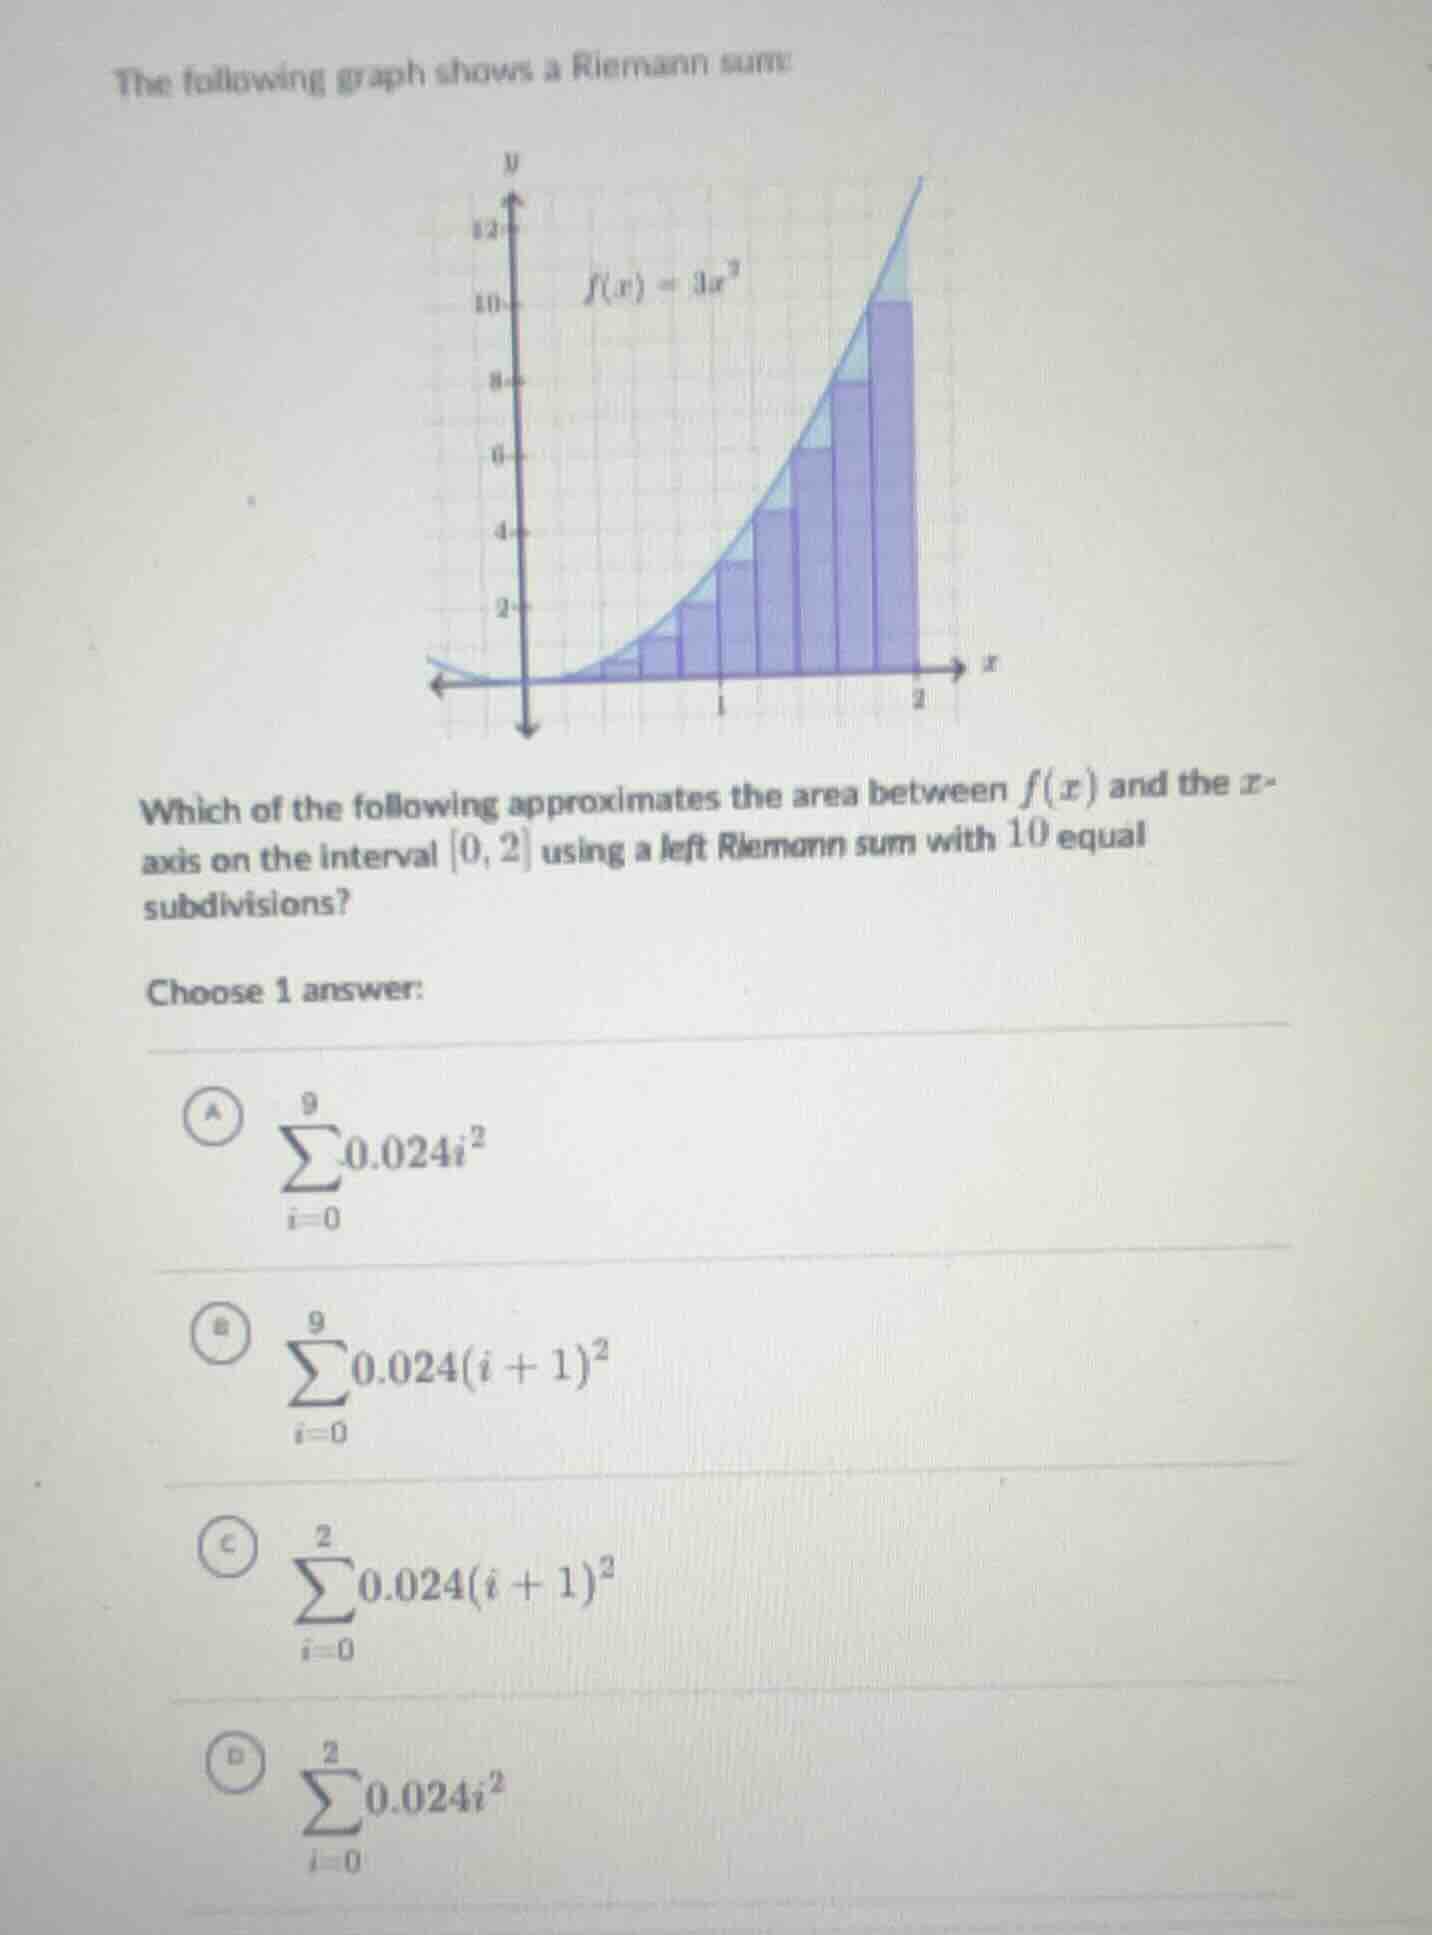
the following graph shows a riemann sum
which of the following approximates the area between ( f(x) ) and the ( x )-axis on the interval ( 0, 2 ) using a left riemann sum with 10 equal subdivisions?
choose 1 answer:
a ( sum_{i = 0}^{9} 0.024i^2 )
b ( sum_{i = 0}^{9} 0.024(i + 1)^2 )
c ( sum_{i = 0}^{2} 0.024(i + 1)^2 )
d ( sum_{i = 0}^{2} 0.024i^2 )
Step1: Calculate subinterval width
The interval is $[0,2]$ with 10 subdivisions, so the width $\Delta x = \frac{2-0}{10} = 0.2$.
Step2: Define left endpoints
For left Riemann sum, the $i$-th left endpoint (starting at $i=0$) is $x_i = 0 + i\Delta x = 0.2i$.
Step3: Evaluate function at endpoints
Substitute $x_i$ into $f(x)=3x^2$: $f(x_i)=3(0.2i)^2 = 3\times0.04i^2 = 0.12i^2$.
Step4: Set up Riemann sum
The sum is $\sum_{i=0}^{9} f(x_i)\Delta x = \sum_{i=0}^{9} 0.12i^2 \times 0.2 = \sum_{i=0}^{9} 0.024i^2$.
Step5: Match to options
This matches option A.

Snap & solve any problem in the app
Get step-by-step solutions on Sovi AI
Photo-based solutions with guided steps
Explore more problems and detailed explanations
A. $\sum_{i=0}^{9}0.024i^{2}$