QUESTION IMAGE
Question
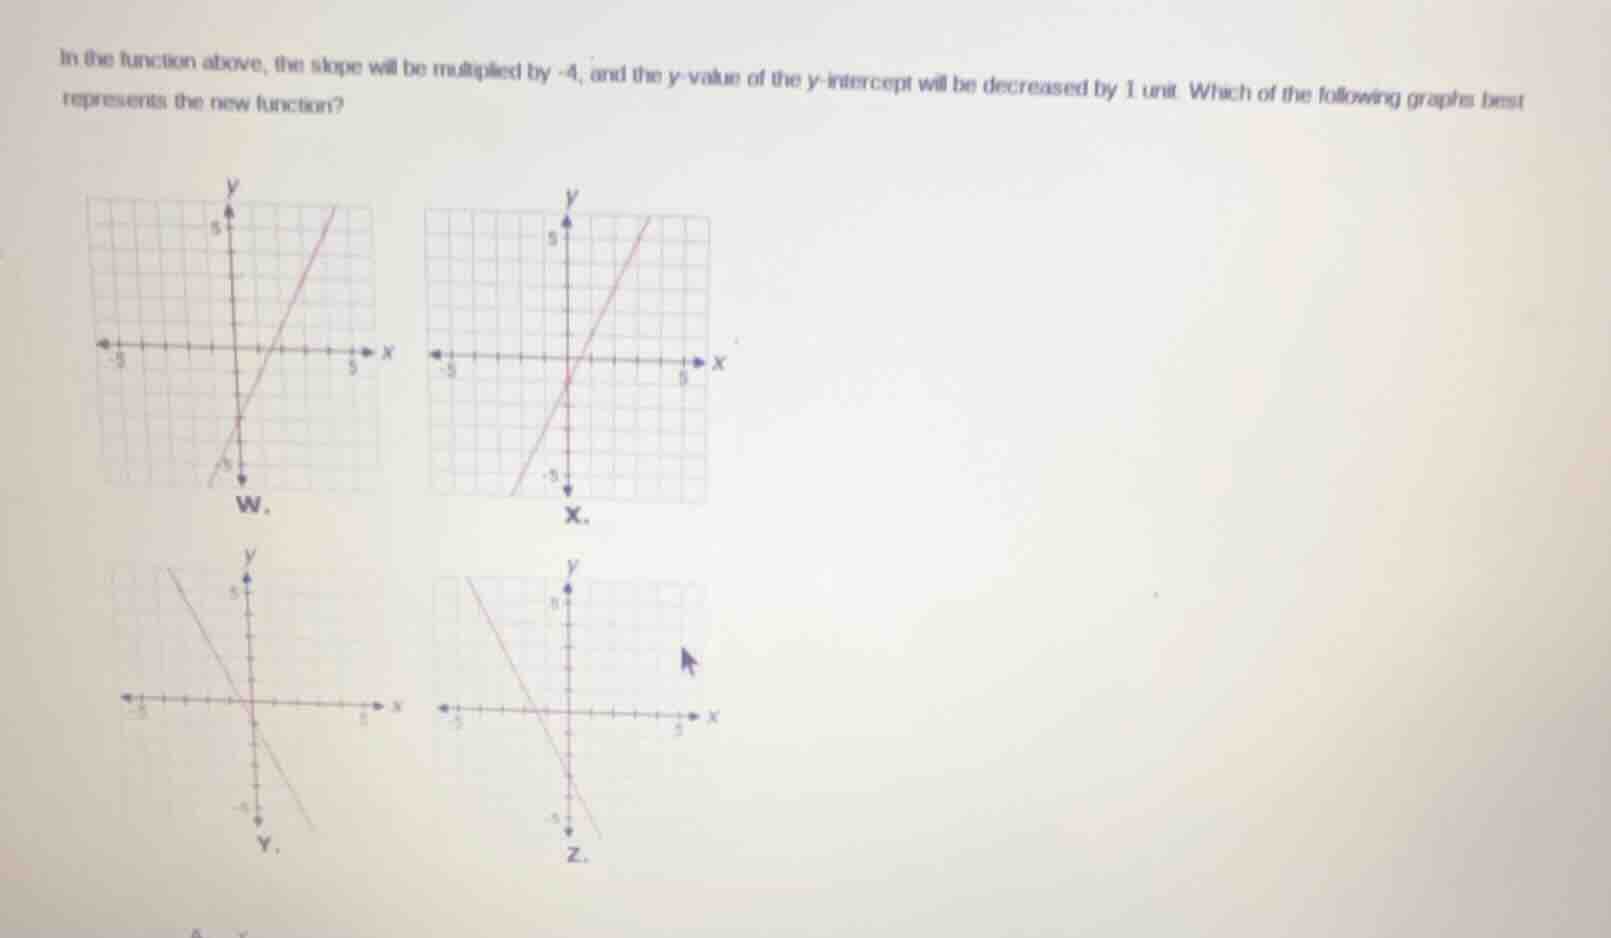
in the function above, the slope will be multiplied by -4, and the y-value of the y-intercept will be decreased by 1 unit. which of the following graphs best represents the new function?
Step1: Identify original function
First, take graph W (the original function): it crosses y-axis at $(0,-2)$, so y-intercept $b=-2$. Slope $m=\frac{\text{rise}}{\text{run}}=\frac{3}{1}=3$. Original function: $y=3x-2$.
Step2: Transform slope
Multiply slope by -4: $m_{\text{new}}=3\times(-4)=-12$.
Step3: Transform y-intercept
Decrease y-intercept by 1: $b_{\text{new}}=-2-1=-3$.
Step4: New function & properties
New function: $y=-12x-3$. It has a negative steep slope, y-intercept at $(0,-3)$.

Snap & solve any problem in the app
Get step-by-step solutions on Sovi AI
Photo-based solutions with guided steps
Explore more problems and detailed explanations
Z. The graph with a steep negative slope and y-intercept at (0,-3)