QUESTION IMAGE
Question
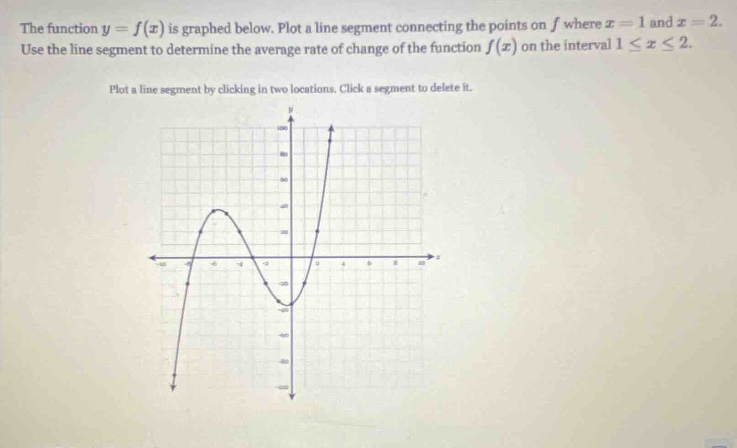
the function $y = f(x)$ is graphed below. plot a line segment connecting the points on $f$ where $x = 1$ and $x = 2$. use the line segment to determine the average rate of change of the function $f(x)$ on the interval $1 \leq x \leq 2$. plot a line segment by clicking in two locations. click a segment to delete it.
Step1: Find f(1) and f(2) from the graph
From the graph, when \( x = 1 \), the \( y \)-value ( \( f(1) \)) is -10 (assuming the grid and the curve's position). When \( x = 2 \), the \( y \)-value ( \( f(2) \)) is 20 (from the graph's grid and the curve's point at \( x = 2 \)).
Step2: Apply the average rate of change formula
The formula for the average rate of change of a function \( f(x) \) on the interval \([a, b]\) is \( \frac{f(b)-f(a)}{b - a} \). Here, \( a = 1 \), \( b = 2 \), \( f(a)=f(1)=- 10 \), \( f(b)=f(2)=20 \).
Substitute the values into the formula:
\[
\frac{f(2)-f(1)}{2 - 1}=\frac{20-(-10)}{2 - 1}=\frac{20 + 10}{1}=\frac{30}{1}=30
\]

Snap & solve any problem in the app
Get step-by-step solutions on Sovi AI
Photo-based solutions with guided steps
Explore more problems and detailed explanations
The average rate of change of \( f(x) \) on the interval \( 1\leq x\leq2 \) is \( 30 \).