QUESTION IMAGE
Question
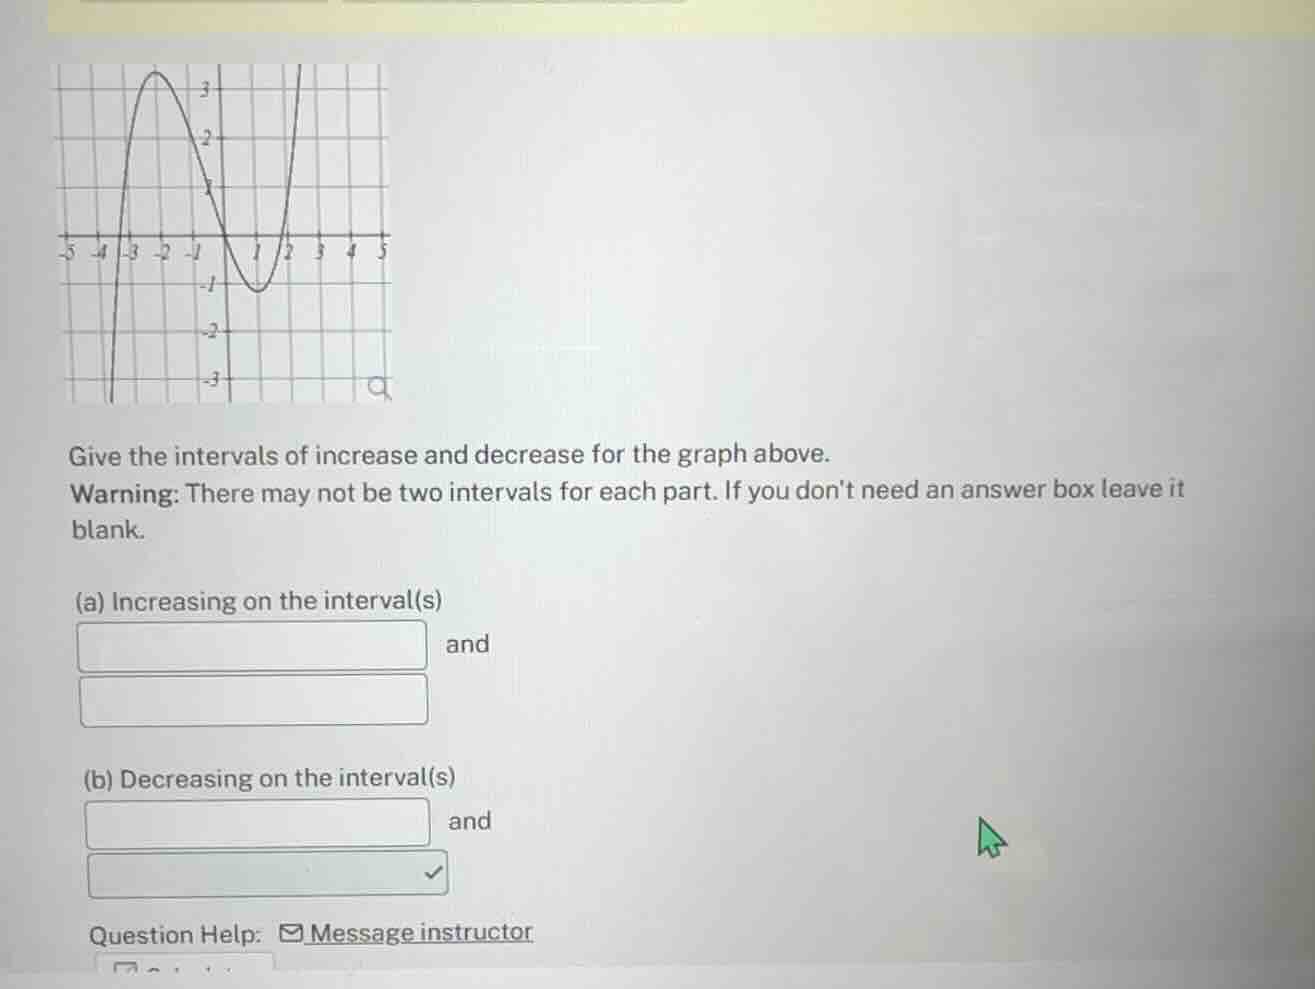
give the intervals of increase and decrease for the graph above.
warning: there may not be two intervals for each part. if you dont need an answer box leave it blank.
(a) increasing on the interval(s)
and
(b) decreasing on the interval(s)
and
question help: ◇message instructor
Step1: Analyze the graph's slope for increasing
A function is increasing when as \( x \) increases, \( y \) increases (the graph rises from left to right). Looking at the graph, from \( x = -3 \) to \( x = -2 \) (the peak), the graph rises. Then from \( x = 1 \) to \( x = 3 \) (and beyond), the graph also rises. So the increasing intervals are \( (-3, -2) \) and \( (1, \infty) \)? Wait, no, let's check the x - axis. Wait, the vertexes: first, the left peak is at \( x=-2 \), then it decreases until \( x = 1 \) (the minimum), then increases. Wait, the x - values: the left part, from \( x=-3 \) (where it starts rising) to \( x=-2 \) (the maximum), then it decreases from \( x=-2 \) to \( x = 1 \) (the minimum), then increases from \( x = 1 \) to \( \infty \). Wait, let's check the coordinates. The graph: when \( x \) is less than - 2, say from \( x=-3 \) to \( x=-2 \), the graph is increasing (going up). Then from \( x=-2 \) to \( x = 1 \), the graph is decreasing (going down). Then from \( x = 1 \) to \( \infty \), the graph is increasing (going up). Wait, maybe the key points: the local maximum at \( x=-2 \), local minimum at \( x = 1 \). So the intervals of increase are where the function's slope is positive: from \( (-\infty, -2) \)? Wait no, looking at the graph, the leftmost part: at \( x=-4 \), the graph is low, then rises to \( x=-2 \) (peak), then falls to \( x = 1 \) (valley), then rises again. Wait, maybe I misread the x - axis. Let's see the grid: the x - axis has - 5, - 4, - 3, - 2, - 1, 0, 1, 2, 3, 4, 5. The graph: at \( x=-3 \), it starts rising, peaks at \( x=-2 \), then falls until \( x = 1 \), then rises again. Wait, maybe the correct intervals: increasing on \( (-\infty, -2) \) and \( (1, \infty) \), decreasing on \( (-2, 1) \). Wait, but the graph at \( x=-4 \) is below, then rises to \( x=-2 \) (so from \( -\infty \) to - 2, it's increasing? Wait, maybe the left part: the graph comes from below (at \( x=-5 \), it's low), rises to \( x=-2 \) (peak), then falls to \( x = 1 \) (valley), then rises. So increasing intervals: \( (-\infty, -2) \) and \( (1, \infty) \), decreasing interval: \( (-2, 1) \). Wait, but the problem's graph: let's check the x - intercepts. The graph crosses the x - axis at \( x=-3 \) (maybe), \( x = 0 \), and \( x = 2 \). Wait, maybe the key points: the local maximum at \( x=-2 \), local minimum at \( x = 1 \). So:
Step1: Determine increasing intervals
A function is increasing when, as \( x \) increases, \( f(x) \) increases. So we look for where the graph is rising. From the graph, the function rises from \( -\infty \) to \( x=-2 \) (the local maximum), then falls from \( x=-2 \) to \( x = 1 \) (the local minimum), then rises from \( x = 1 \) to \( \infty \). So the increasing intervals are \( (-\infty, -2) \) and \( (1, \infty) \).
Step2: Determine decreasing intervals
A function is decreasing when, as \( x \) increases, \( f(x) \) decreases. So from \( x=-2 \) to \( x = 1 \), the graph is falling, so the decreasing interval is \( (-2, 1) \).
Wait, but maybe the graph's left part: at \( x=-3 \), it's rising, so from \( -\infty \) to - 2, it's increasing. Then from - 2 to 1, decreasing. Then from 1 to \( \infty \), increasing.
So for part (a) increasing intervals: \( (-\infty, -2) \) and \( (1, \infty) \)
For part (b) decreasing interval: \( (-2, 1) \)

Snap & solve any problem in the app
Get step-by-step solutions on Sovi AI
Photo-based solutions with guided steps
Explore more problems and detailed explanations
(a) Increasing on the interval(s) \( (-\infty, -2) \) and \( (1, \infty) \)
(b) Decreasing on the interval(s) \( (-2, 1) \)