QUESTION IMAGE
Question
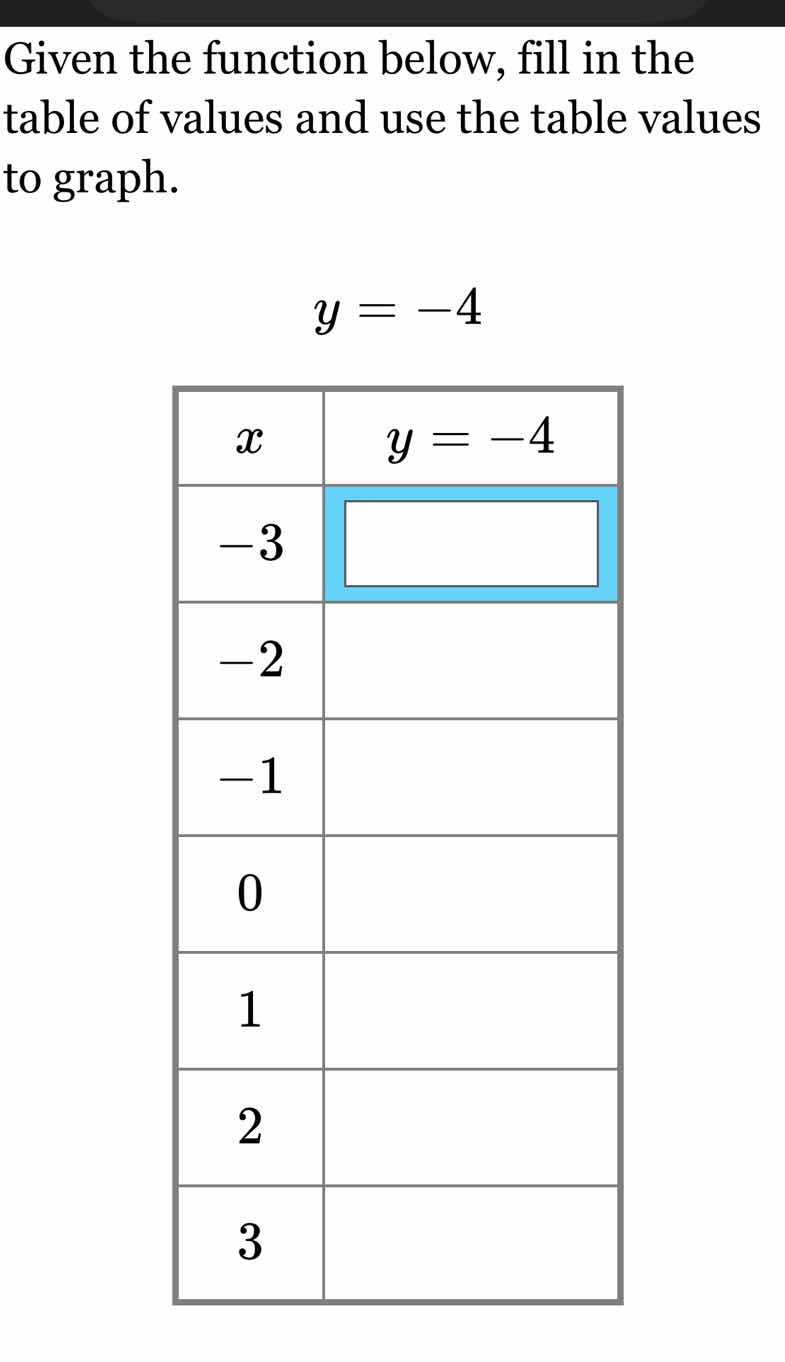
given the function below, fill in the table of values and use the table values to graph.
y = -4
| x | y = -4 |
| -3 | |
| -2 | |
| -1 | |
| 0 | |
| 1 | |
| 2 | |
| 3 |
Step1: Analyze the function
The function is \( y = -4 \), which is a constant function. This means that for any value of \( x \), the value of \( y \) will always be \(-4\).
Step2: Fill in the table
For each \( x \)-value (\(-3, -2, -1, 0, 1, 2, 3\)), the corresponding \( y \)-value is \(-4\) because the function \( y = -4 \) does not depend on \( x \).
So the completed table is:
| \( x \) | \( y = -4 \) |
|---|---|
| \(-2\) | \(-4\) |
| \(-1\) | \(-4\) |
| \( 0 \) | \(-4\) |
| \( 1 \) | \(-4\) |
| \( 2 \) | \(-4\) |
| \( 3 \) | \(-4\) |

Snap & solve any problem in the app
Get step-by-step solutions on Sovi AI
Photo-based solutions with guided steps
Explore more problems and detailed explanations
For \( x = -3 \), \( y = -4 \); for \( x = -2 \), \( y = -4 \); for \( x = -1 \), \( y = -4 \); for \( x = 0 \), \( y = -4 \); for \( x = 1 \), \( y = -4 \); for \( x = 2 \), \( y = -4 \); for \( x = 3 \), \( y = -4 \) (the table is filled with \(-4\) in each \( y \)-column cell).