QUESTION IMAGE
Question
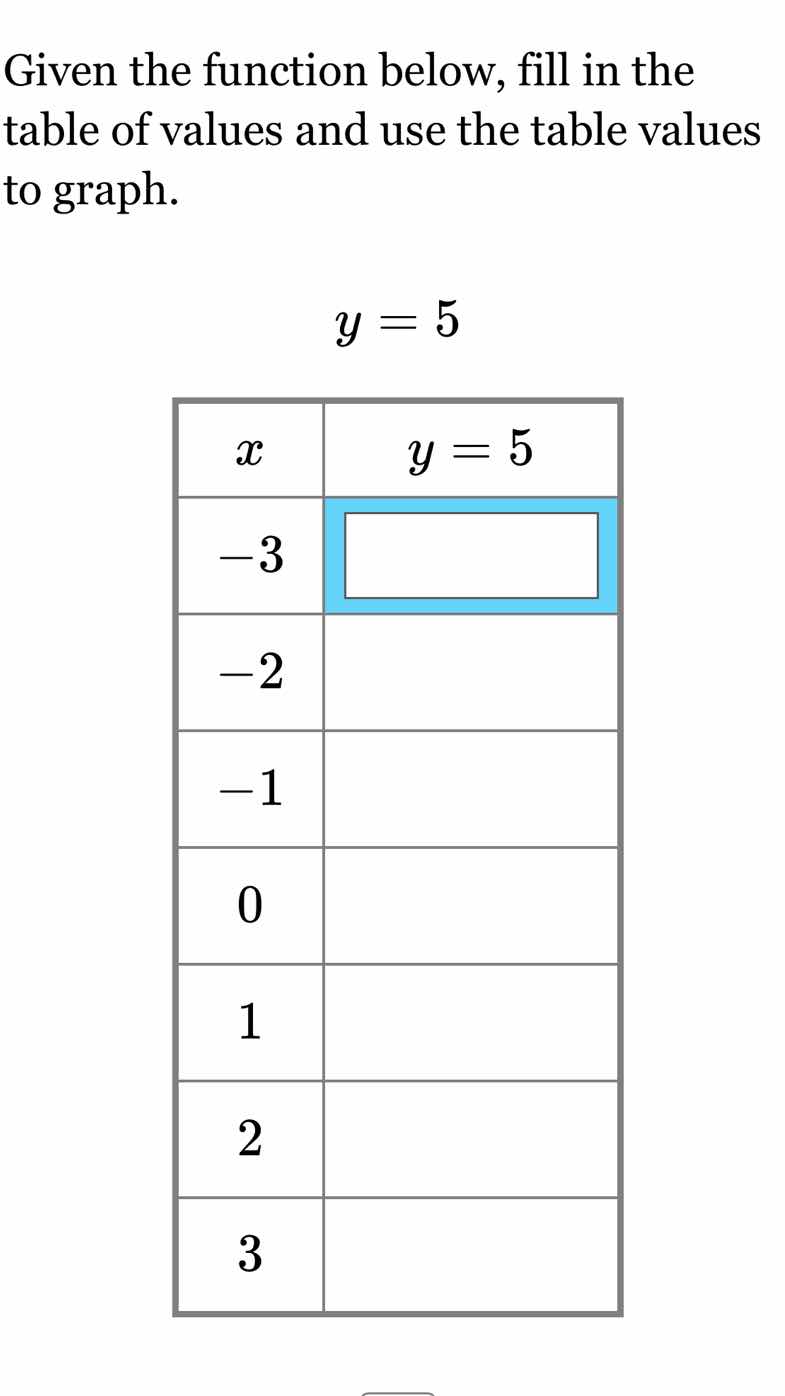
given the function below, fill in the table of values and use the table values to graph.
$y = 5$
| $x$ | $y = 5$ |
|---|---|
| $-2$ | |
| $-1$ | |
| $0$ | |
| $1$ | |
| $2$ | |
| $3$ |
Step1: Analyze the function
The function is \( y = 5 \), which is a constant function. This means that for any value of \( x \), the value of \( y \) will always be 5.
Step2: Fill in the table
For each \( x \)-value (-3, -2, -1, 0, 1, 2, 3), the corresponding \( y \)-value is 5. So we fill each cell in the \( y = 5 \) column with 5.

Snap & solve any problem in the app
Get step-by-step solutions on Sovi AI
Photo-based solutions with guided steps
Explore more problems and detailed explanations
For \( x=-3 \), \( y = 5 \); for \( x=-2 \), \( y = 5 \); for \( x=-1 \), \( y = 5 \); for \( x=0 \), \( y = 5 \); for \( x=1 \), \( y = 5 \); for \( x=2 \), \( y = 5 \); for \( x=3 \), \( y = 5 \). The filled table is:
| \( x \) | \( y = 5 \) |
|---|---|
| -2 | 5 |
| -1 | 5 |
| 0 | 5 |
| 1 | 5 |
| 2 | 5 |
| 3 | 5 |