QUESTION IMAGE
Question
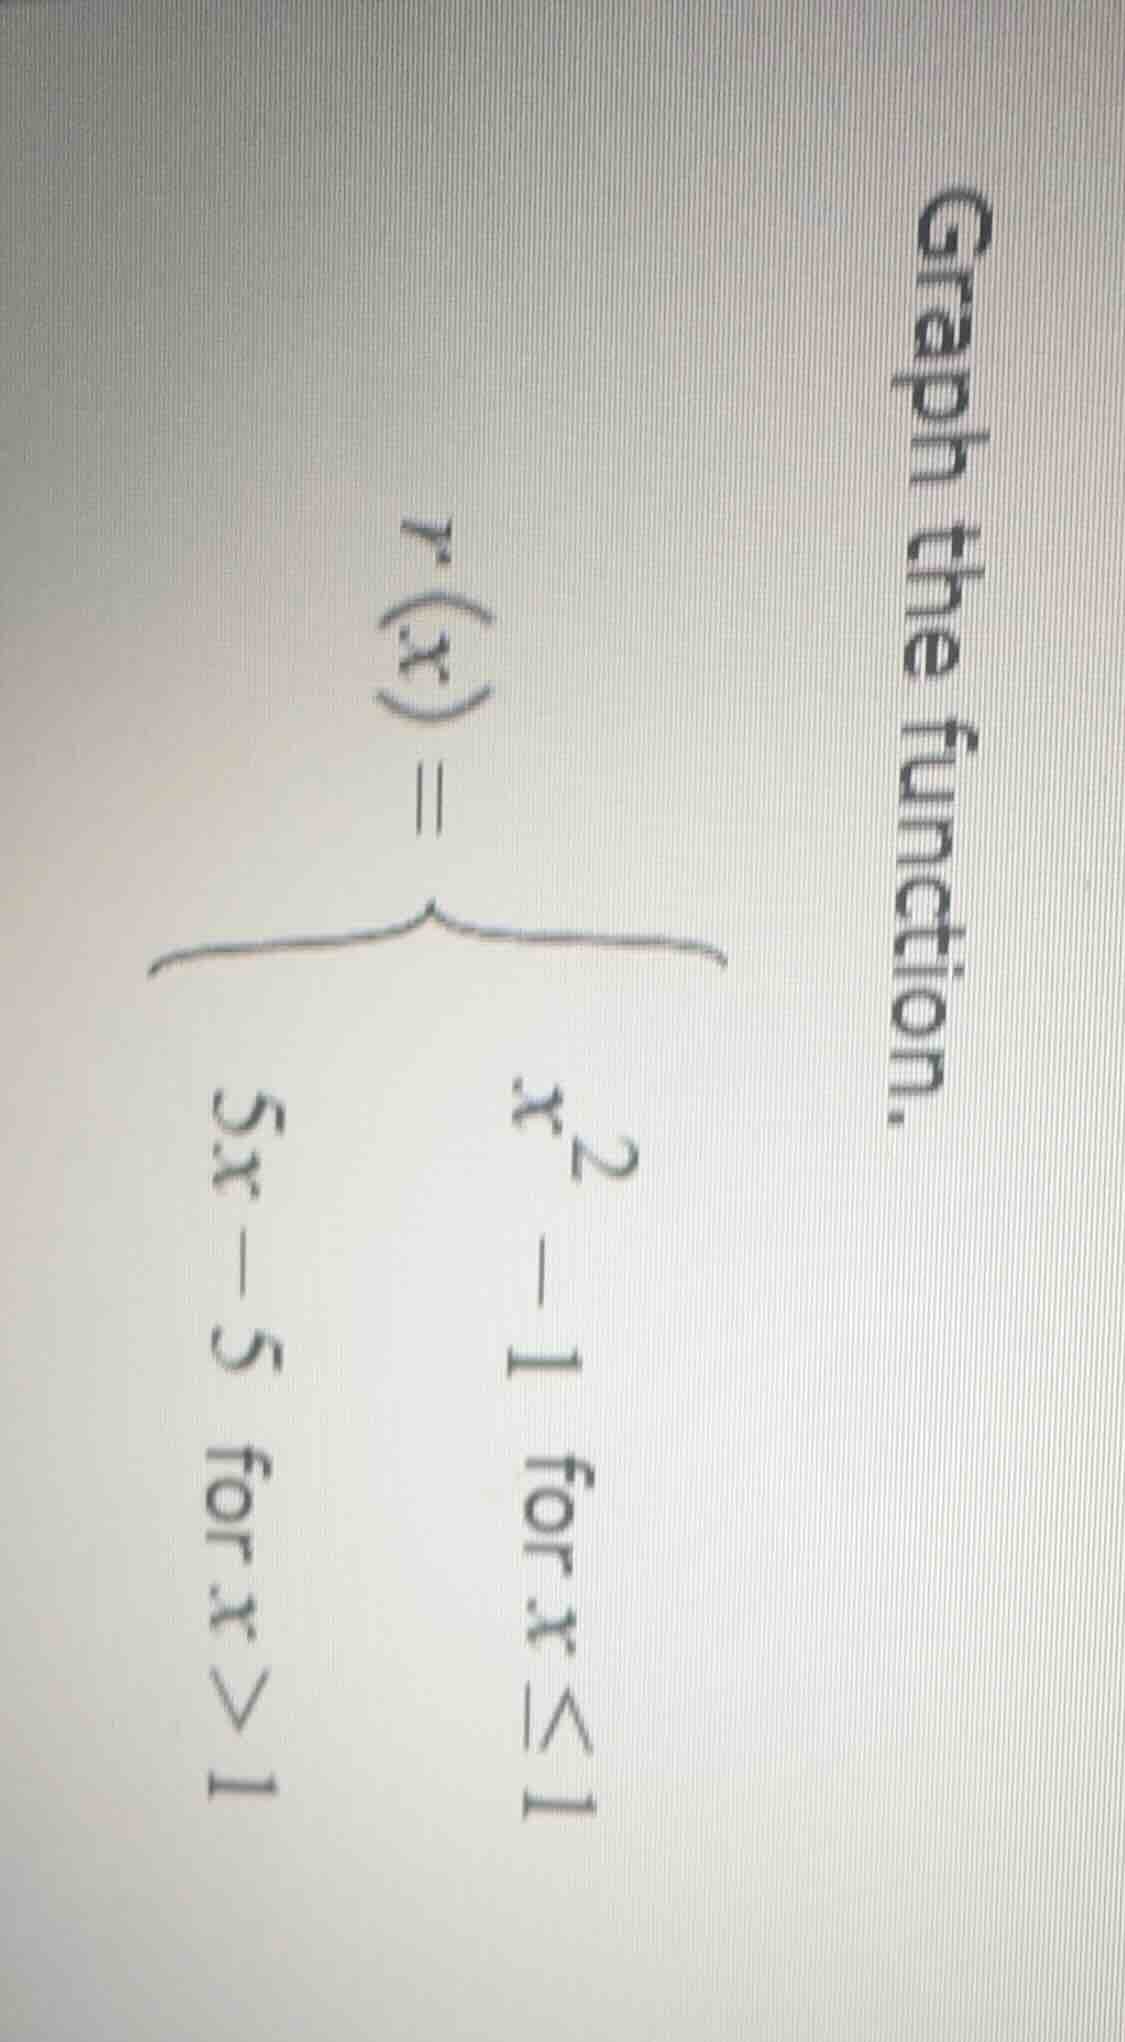
graph the function.
$r(x)=\
$
Step1: Analyze first piece ($x \leq 1$)
This is a quadratic function $r(x) = x^2 - 1$. It is a parabola opening upwards with vertex at $(0, -1)$. We plot all points where $x$ is less than or equal to 1, with a closed dot at $x=1$:
$r(1) = 1^2 - 1 = 0$, so the point is $(1, 0)$.
Step2: Analyze second piece ($x > 1$)
This is a linear function $r(x) = 5x - 5$. It has a slope of 5 and y-intercept at $(0, -5)$. We plot all points where $x$ is greater than 1, with an open dot at $x=1$ (to show it's not included here):
$r(1) = 5(1) - 5 = 0$, so the open dot is at $(1, 0)$ (this aligns with the closed dot from the first piece, making the function continuous at $x=1$).
Step3: Combine the two graphs
Plot the parabola $x^2 - 1$ for $x \leq 1$, and the line $5x - 5$ for $x > 1$, ensuring the correct endpoint notation.

Snap & solve any problem in the app
Get step-by-step solutions on Sovi AI
Photo-based solutions with guided steps
Explore more problems and detailed explanations
The graph consists of:
- The left portion: the parabola $y = x^2 - 1$ for all $x \leq 1$, with a closed point at $(1, 0)$.
- The right portion: the straight line $y = 5x - 5$ for all $x > 1$, with an open point at $(1, 0)$ (which coincides with the closed point from the parabola, creating a continuous graph).