QUESTION IMAGE
Question
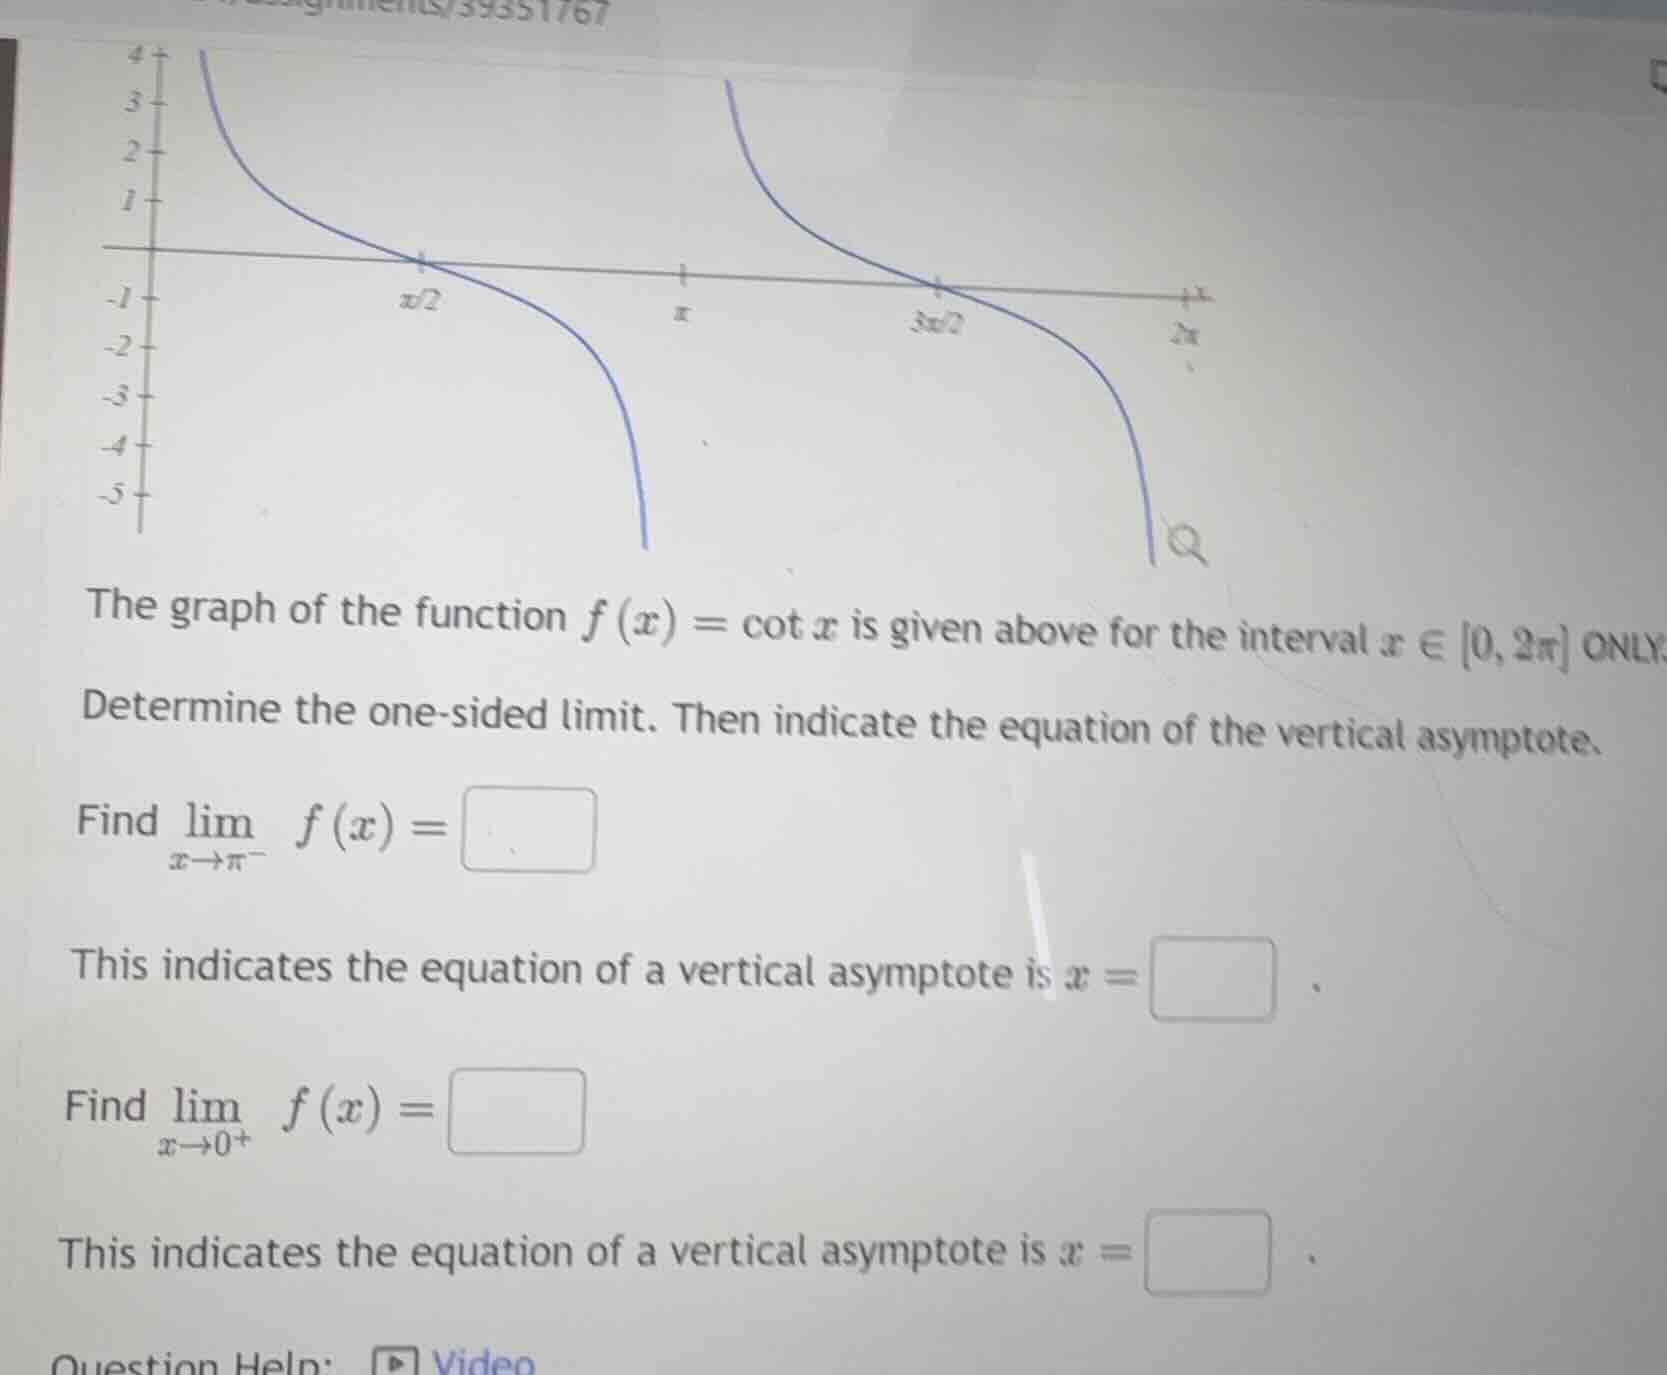
the graph of the function $f(x) = \cot x$ is given above for the interval $x \in 0, 2\pi$ only. determine the one - sided limit. then indicate the equation of the vertical asymptote. find $\lim\limits_{x\to\pi^{-}} f(x) = \square$ this indicates the equation of a vertical asymptote is $x = \square$. find $\lim\limits_{x\to 0^{+}} f(x) = \square$ this indicates the equation of a vertical asymptote is $x = \square$. question help: video
Step1: Analyze $x\to\pi^-$ behavior
Observe graph left of $x=\pi$: $f(x)\to-\infty$
Step2: Identify vertical asymptote
Asymptote at $x=\pi$ (limit is unbounded)
Step3: Analyze $x\to0^+$ behavior
Observe graph right of $x=0$: $f(x)\to+\infty$
Step4: Identify vertical asymptote
Asymptote at $x=0$ (limit is unbounded)

Snap & solve any problem in the app
Get step-by-step solutions on Sovi AI
Photo-based solutions with guided steps
Explore more problems and detailed explanations
$\lim_{x\to\pi^-} f(x) = -\infty$
This indicates the equation of a vertical asymptote is $x = \pi$
$\lim_{x\to0^+} f(x) = +\infty$
This indicates the equation of a vertical asymptote is $x = 0$