QUESTION IMAGE
Question
graph the function, and then identify the
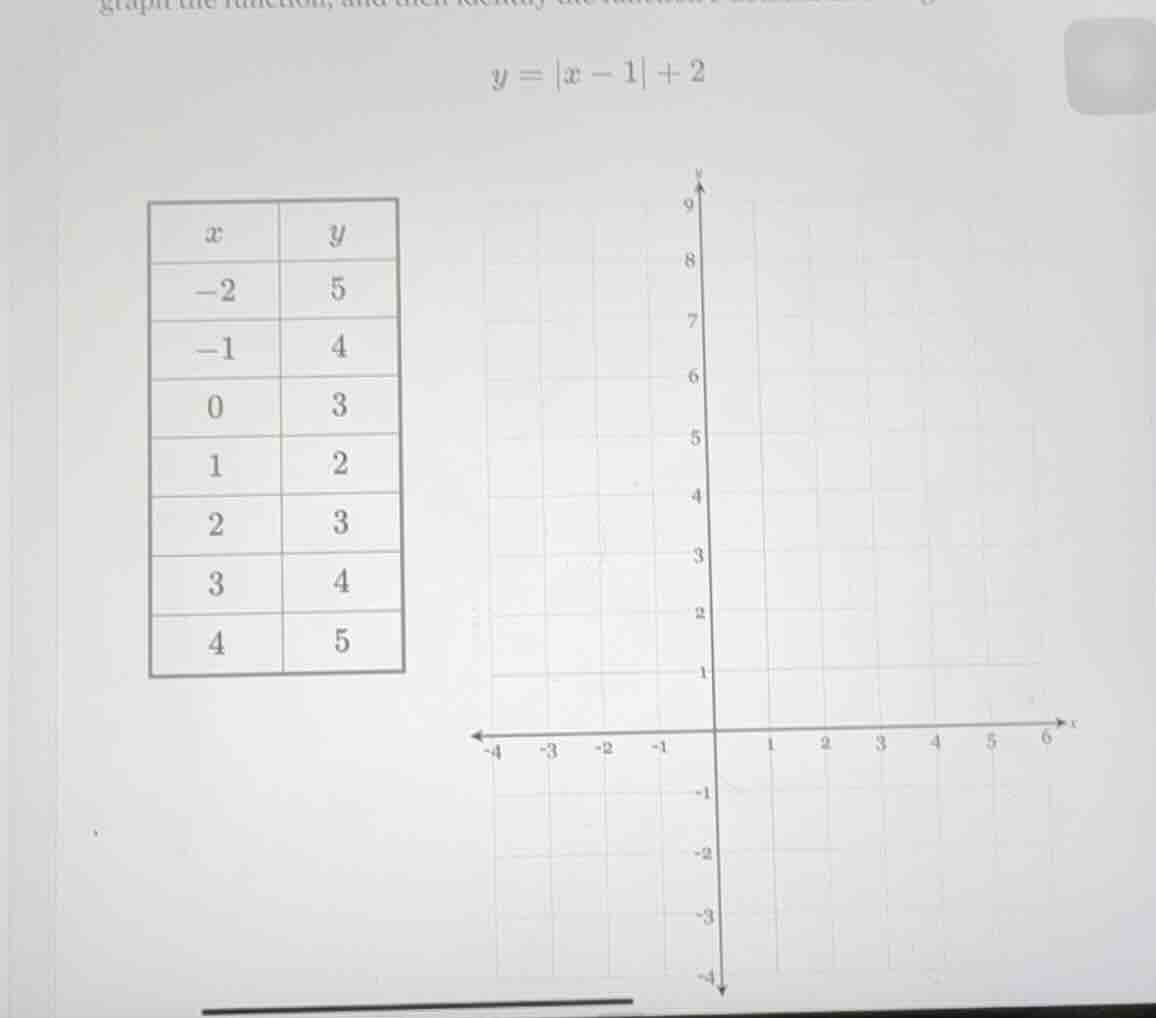
y = |x - 1| + 2
Step1: Plot given coordinate pairs
Plot each $(x,y)$ pair from the table: $(-2,5)$, $(-1,4)$, $(0,3)$, $(1,2)$, $(2,3)$, $(3,4)$, $(4,5)$ on the coordinate grid.
Step2: Connect the plotted points
Draw straight lines between consecutive points to form the V-shaped graph of the absolute value function.
Step3: Identify key features (optional)
The vertex of $y=|x-1|+2$ is at $(1,2)$, which matches the plotted minimum point.

Snap & solve any problem in the app
Get step-by-step solutions on Sovi AI
Photo-based solutions with guided steps
Explore more problems and detailed explanations
The graph is a V-shaped curve with vertex at $(1,2)$, passing through all the points from the table: $(-2,5)$, $(-1,4)$, $(0,3)$, $(2,3)$, $(3,4)$, $(4,5)$. When plotted and connected, it forms the graph of the absolute value function $y=|x-1|+2$.