QUESTION IMAGE
Question
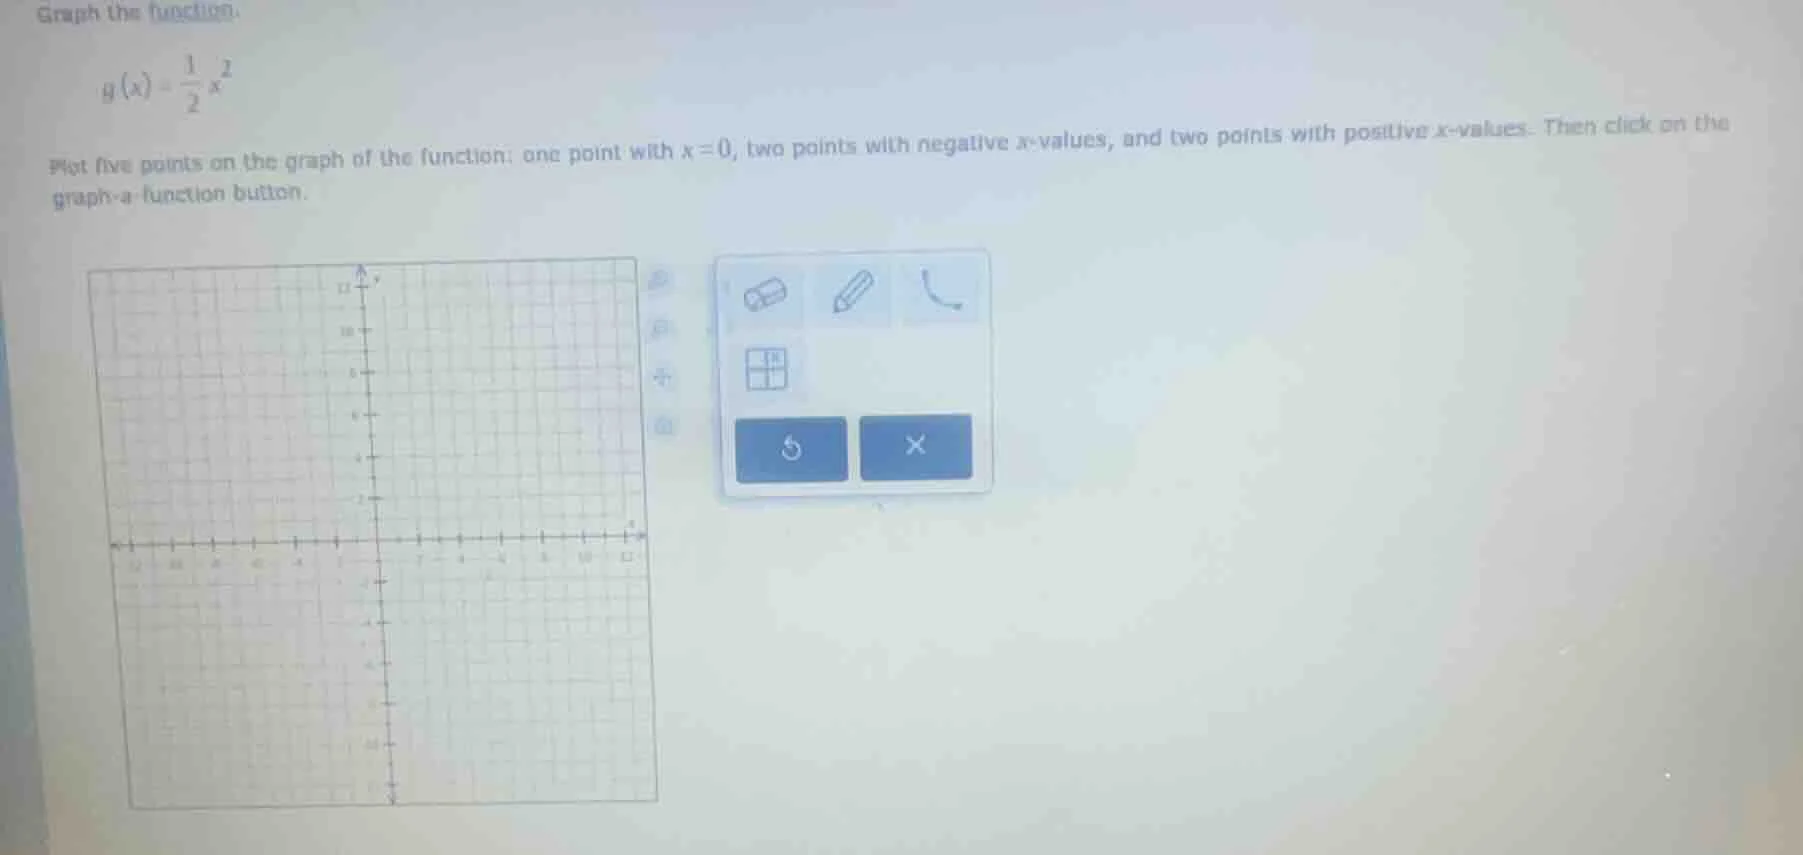
graph the function:
( g(x) = \frac{1}{2}x^2 )
plot five points on the graph of the function: one point with ( x = 0 ), two points with negative ( x )-values, and two points with positive ( x )-values. then click on the graph - a - function button.
Step1: Calculate x=0 point
Substitute $x=0$:
$g(0)=\frac{1}{2}(0)^2=0$
Point: $(0, 0)$
Step2: Calculate negative x points
Substitute $x=-2$:
$g(-2)=\frac{1}{2}(-2)^2=\frac{1}{2}(4)=2$
Point: $(-2, 2)$
Substitute $x=-4$:
$g(-4)=\frac{1}{2}(-4)^2=\frac{1}{2}(16)=8$
Point: $(-4, 8)$
Step3: Calculate positive x points
Substitute $x=2$:
$g(2)=\frac{1}{2}(2)^2=\frac{1}{2}(4)=2$
Point: $(2, 2)$
Substitute $x=4$:
$g(4)=\frac{1}{2}(4)^2=\frac{1}{2}(16)=8$
Point: $(4, 8)$

Snap & solve any problem in the app
Get step-by-step solutions on Sovi AI
Photo-based solutions with guided steps
Explore more problems and detailed explanations
Plot the following points and draw the parabola:
- $(0, 0)$
- $(-2, 2)$
- $(-4, 8)$
- $(2, 2)$
- $(4, 8)$