QUESTION IMAGE
Question
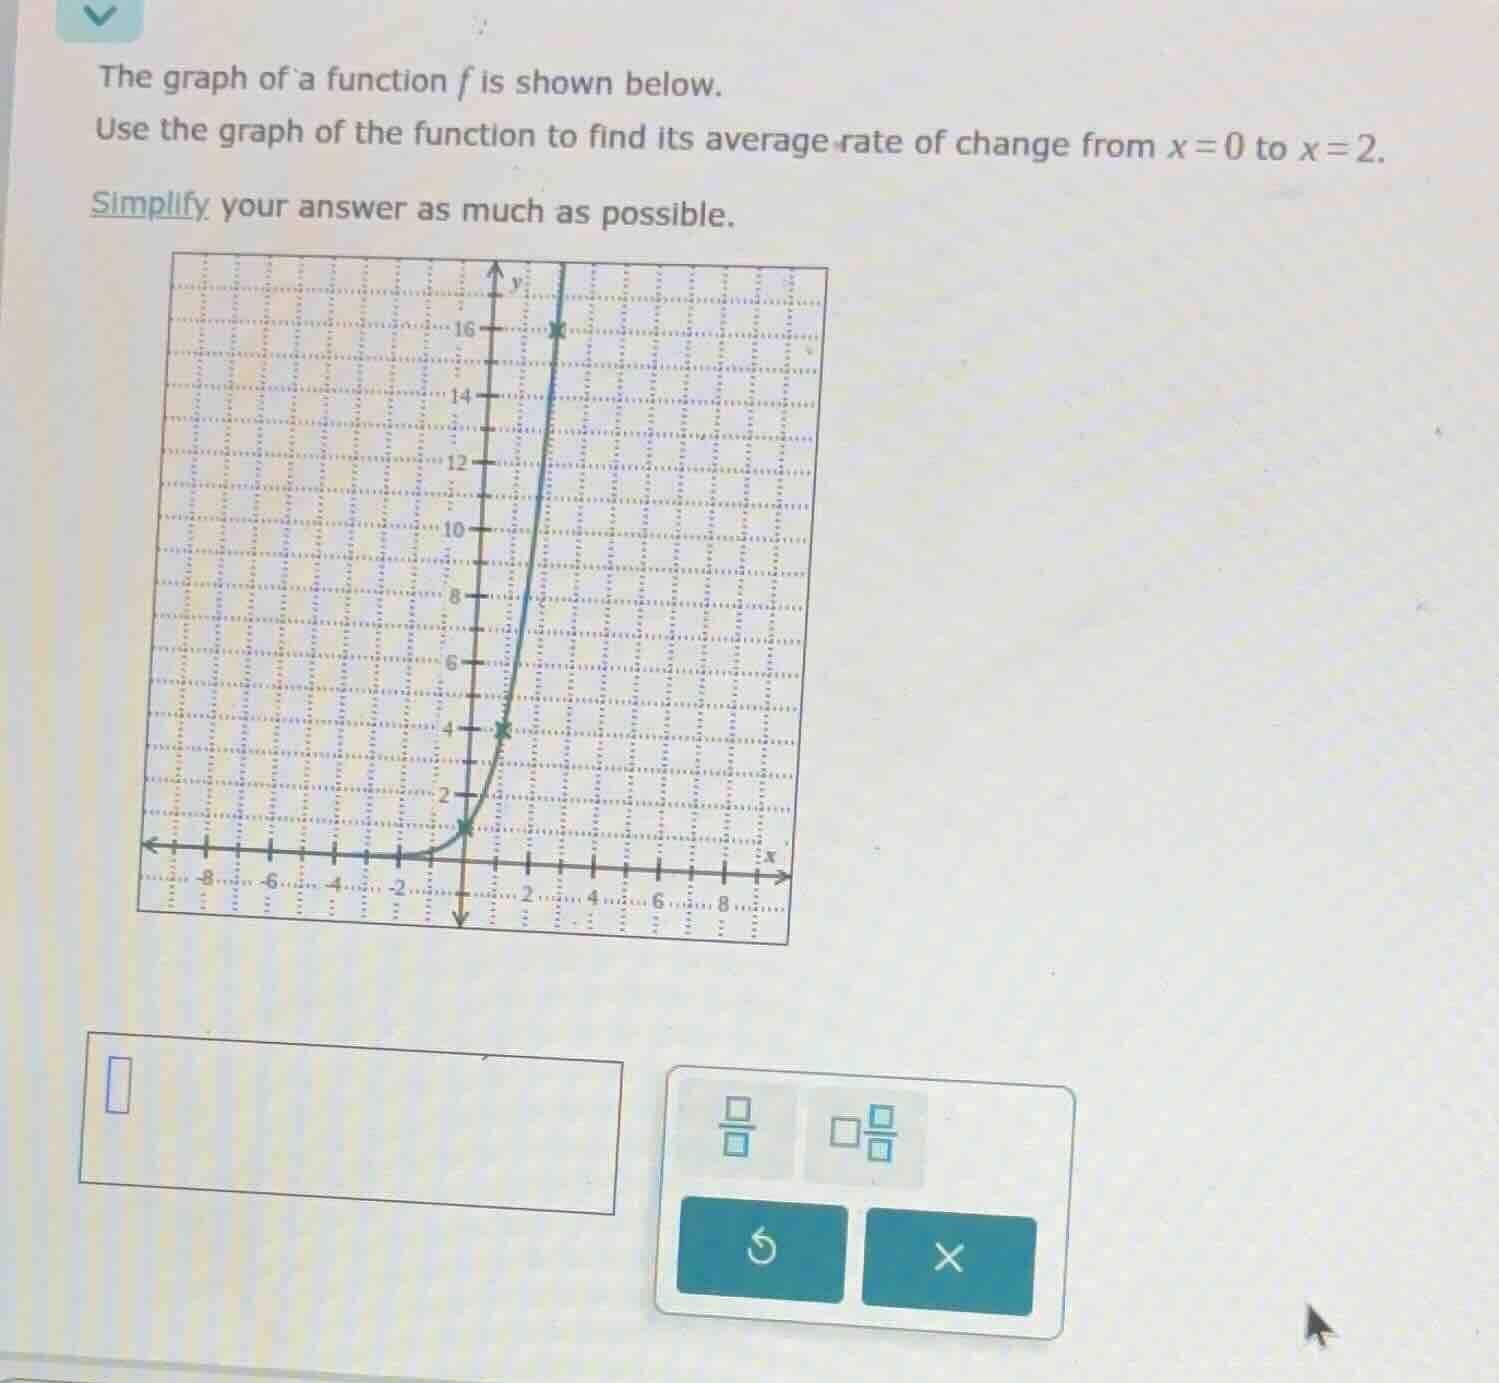
the graph of a function f is shown below. use the graph of the function to find its average rate of change from x = 0 to x = 2. simplify your answer as much as possible.
Step1: Identify f(0) from graph
From the graph, when $x=0$, $f(0)=1$.
Step2: Identify f(2) from graph
From the graph, when $x=2$, $f(2)=16$.
Step3: Apply average rate formula
The average rate of change formula is $\frac{f(b)-f(a)}{b-a}$, where $a=0$, $b=2$.
$\text{Average rate of change} = \frac{f(2)-f(0)}{2-0} = \frac{16-1}{2-0}$
Step4: Simplify the expression
$\frac{16-1}{2-0} = \frac{15}{2}$

Snap & solve any problem in the app
Get step-by-step solutions on Sovi AI
Photo-based solutions with guided steps
Explore more problems and detailed explanations
$\frac{15}{2}$