QUESTION IMAGE
Question
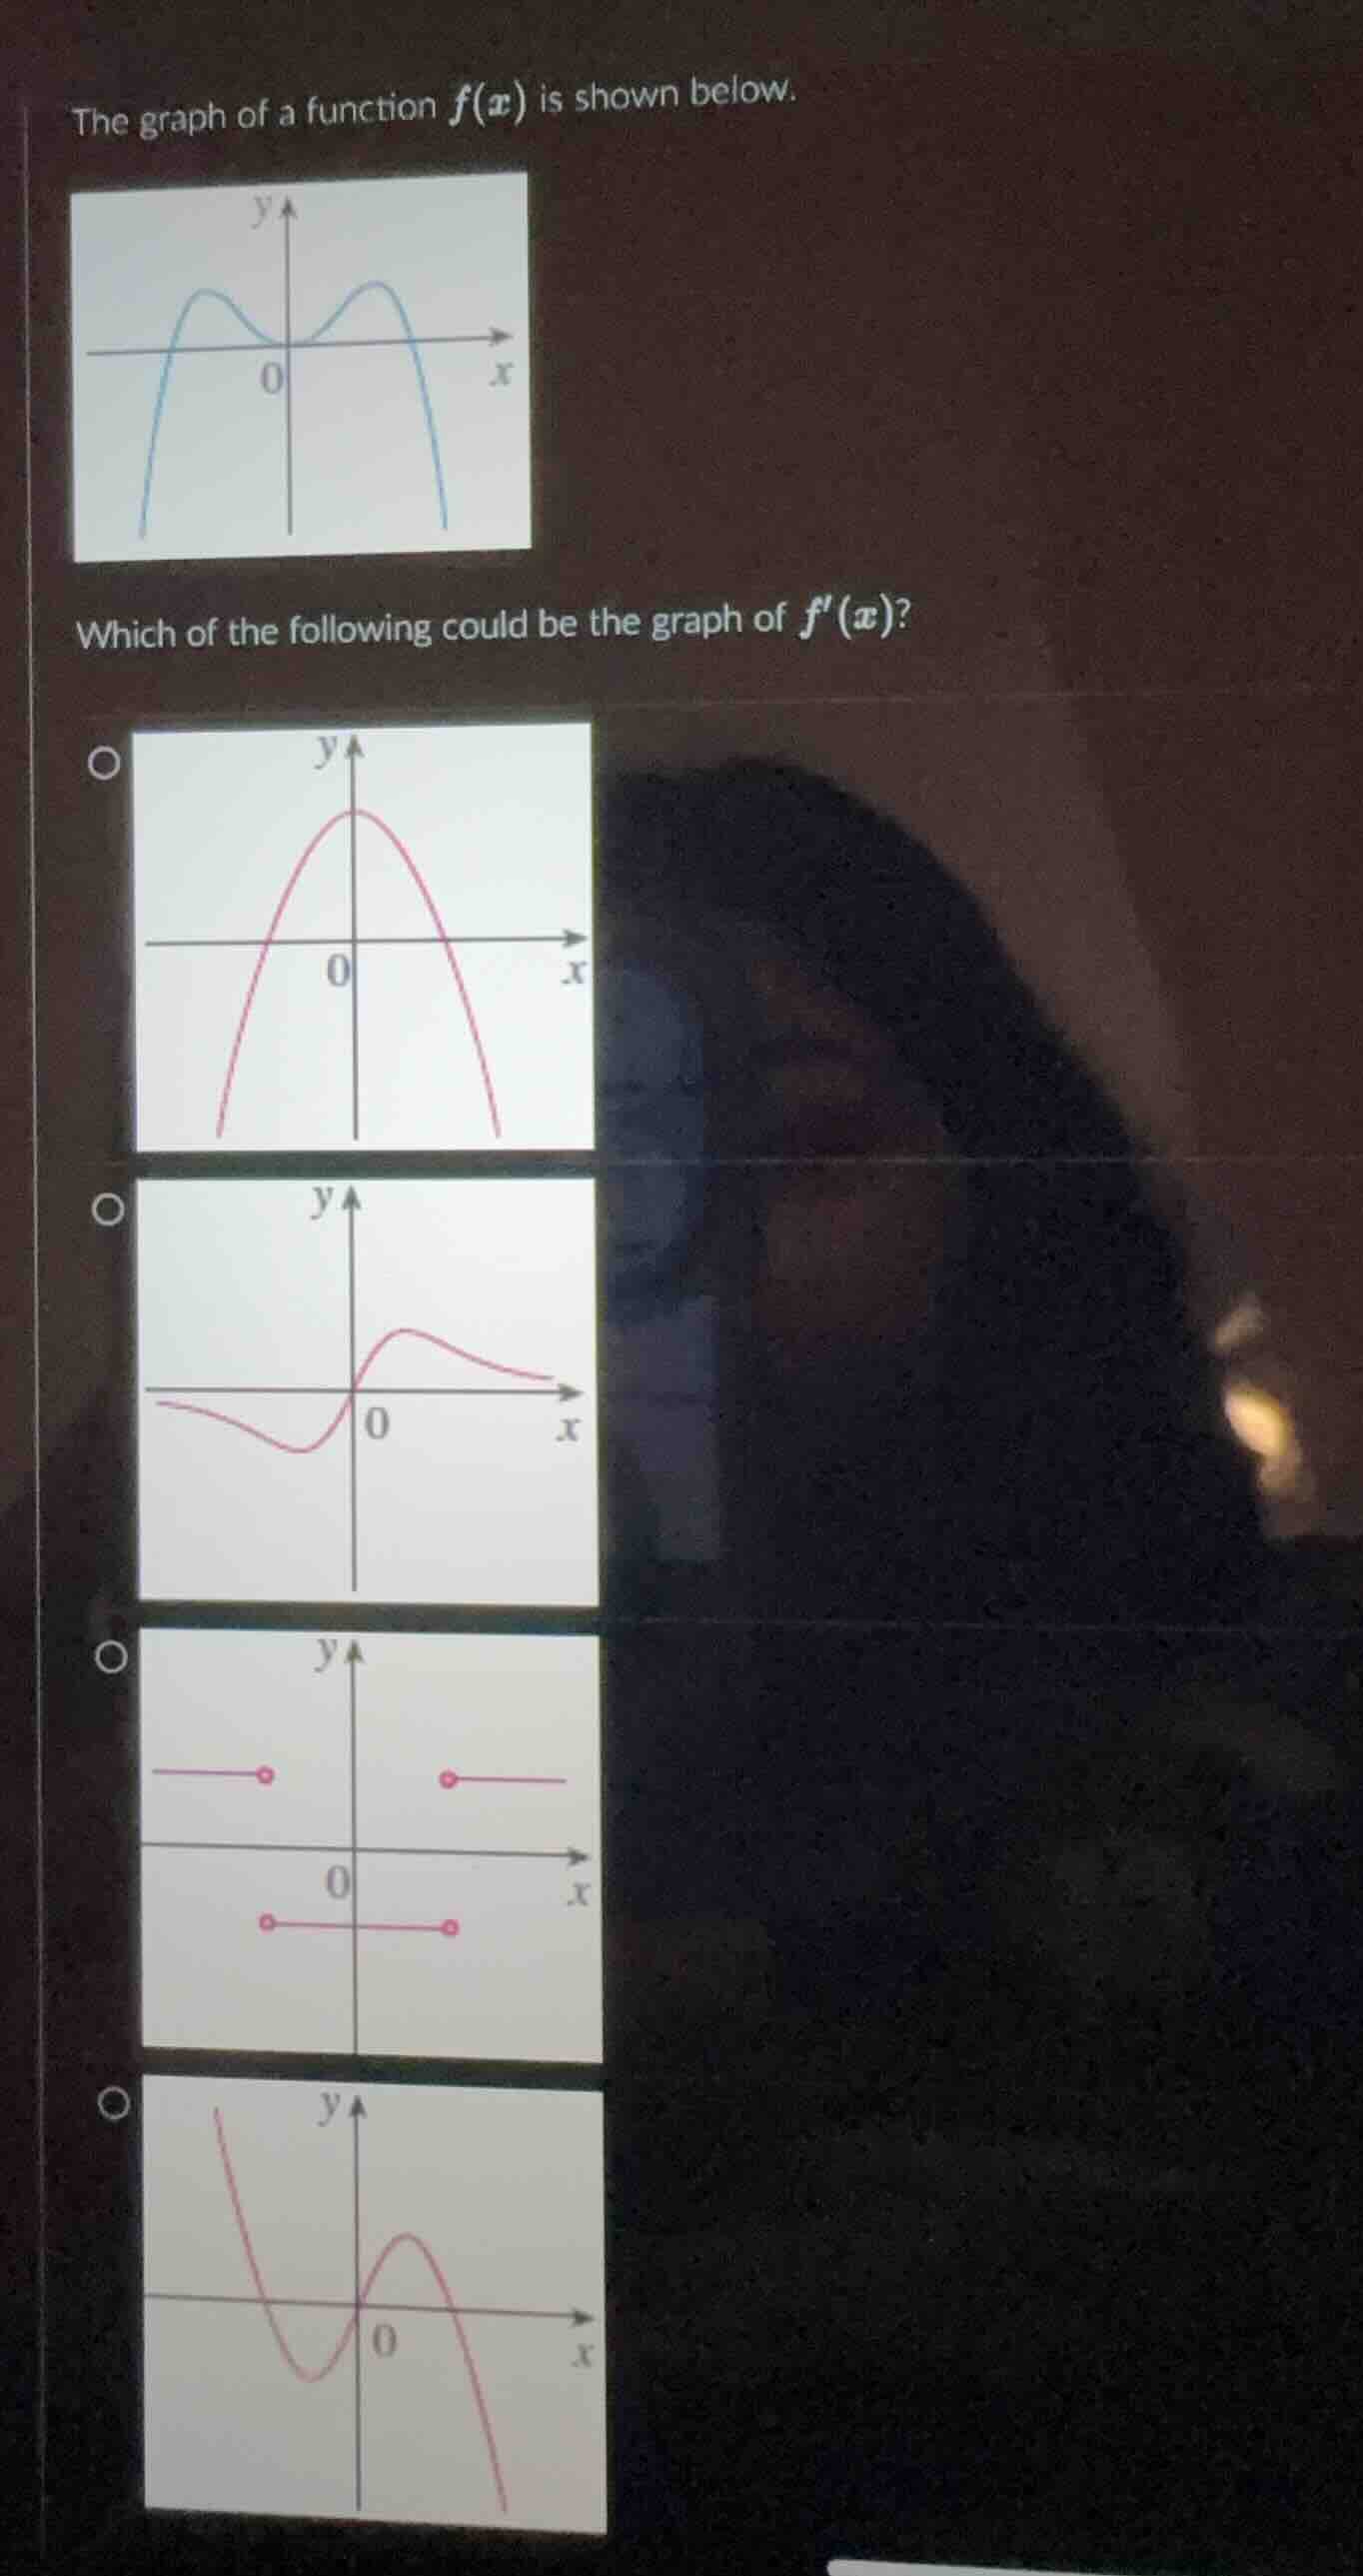
the graph of a function $f(x)$ is shown below. which of the following could be the graph of $f(x)$?
Step1: Analyze the original function's graph
The graph of \( f(x) \) is symmetric about the \( y \)-axis (even function), has two local maxima (one on the left of \( y \)-axis, one on the right) and a minimum at \( x = 0 \).
Step2: Recall the relationship between \( f(x) \) and \( f'(x) \)
The derivative \( f'(x) \) represents the slope of the tangent to \( f(x) \) at any point \( x \).
- For \( f(x) \), when \( x < 0 \) (left of \( y \)-axis), the function first increases (slope positive), reaches a local maximum (slope zero), then decreases (slope negative) until \( x = 0 \) (where slope is zero at the minimum).
- When \( x > 0 \) (right of \( y \)-axis), due to symmetry, the function first increases (slope positive), reaches a local maximum (slope zero), then decreases (slope negative).
Step3: Analyze the options
- Option 1 (the first red graph, a downward - opening parabola symmetric about \( y \)-axis): This graph is symmetric about \( y \)-axis. For \( x < 0 \), it starts from below, rises to a maximum at \( x = 0 \), then falls. But our analysis of \( f'(x) \) for \( x < 0 \) should be positive - zero - negative, and for \( x>0 \) positive - zero - negative. Wait, no, let's re - evaluate. Wait, the original \( f(x) \): when \( x < 0 \), as \( x \) increases from \( -\infty \) to the local max, \( f(x) \) is increasing (so \( f'(x)>0 \)), at local max \( f'(x) = 0 \), then from local max to \( x = 0 \), \( f(x) \) is decreasing (so \( f'(x)<0 \)). At \( x = 0 \), \( f(x) \) has a minimum, so the slope changes from negative (just left of 0) to positive (just right of 0), so \( f'(x) \) crosses zero at \( x = 0 \) from negative to positive? Wait, no, the original graph: at \( x = 0 \), the function has a minimum (a "valley" at \( x = 0 \)). So the slope of \( f(x) \) just left of 0 is negative (function decreasing towards 0), and just right of 0 is positive (function increasing from 0). So \( f'(x) \) at \( x = 0 \) is zero, and crosses from negative to positive. But the first option is a downward - opening parabola, which is positive on the left and right of 0, zero at 0? No, wait, no. Wait, maybe I made a mistake. Wait, the original \( f(x) \) is symmetric about \( y \)-axis. Let's consider the derivative of an even function. If \( f(x) \) is even, \( f(-x)=f(x) \), then \( f'(-x)\times(- 1)=f'(x) \), so \( f'(-x)=-f'(x) \), which means \( f'(x) \) is an odd function. Wait, that's a key point! If \( f(x) \) is even, \( f'(x) \) is odd. So \( f'(x) \) should be symmetric about the origin. Let's check the options:
- The second option (the graph with a wave, symmetric about origin? Let's see: the graph on the left of 0 is a downward curve, on the right is an upward curve, symmetric about origin (odd function). Wait, no, let's re - check the options. Wait, the first option is symmetric about \( y \)-axis (even), the second option: when \( x < 0 \), it's a curve that goes down then up, and when \( x>0 \), it goes up then down, symmetric about origin (odd). The third option is piece - wise constant, not matching. The fourth option is not symmetric about origin. Wait, but our earlier analysis of the slope: for \( f(x) \) (even function), \( f'(x) \) is odd. So \( f'(x) \) should satisfy \( f'(-x)=-f'(x) \). So the graph of \( f'(x) \) should be symmetric about the origin. Let's check the second option: the graph on the left of 0 (negative \( x \)): as \( x \) increases from \( -\infty \) to 0, the slope of \( f(x) \): when \( x \) is very negative, \( f(x) \) is increasing (so \( f'(x)>0 \)? No, wait the original \( f(x…

Snap & solve any problem in the app
Get step-by-step solutions on Sovi AI
Photo-based solutions with guided steps
Explore more problems and detailed explanations
The second option (the graph with the wave - like curve symmetric about the origin, the one in the middle of the four options)