QUESTION IMAGE
Question
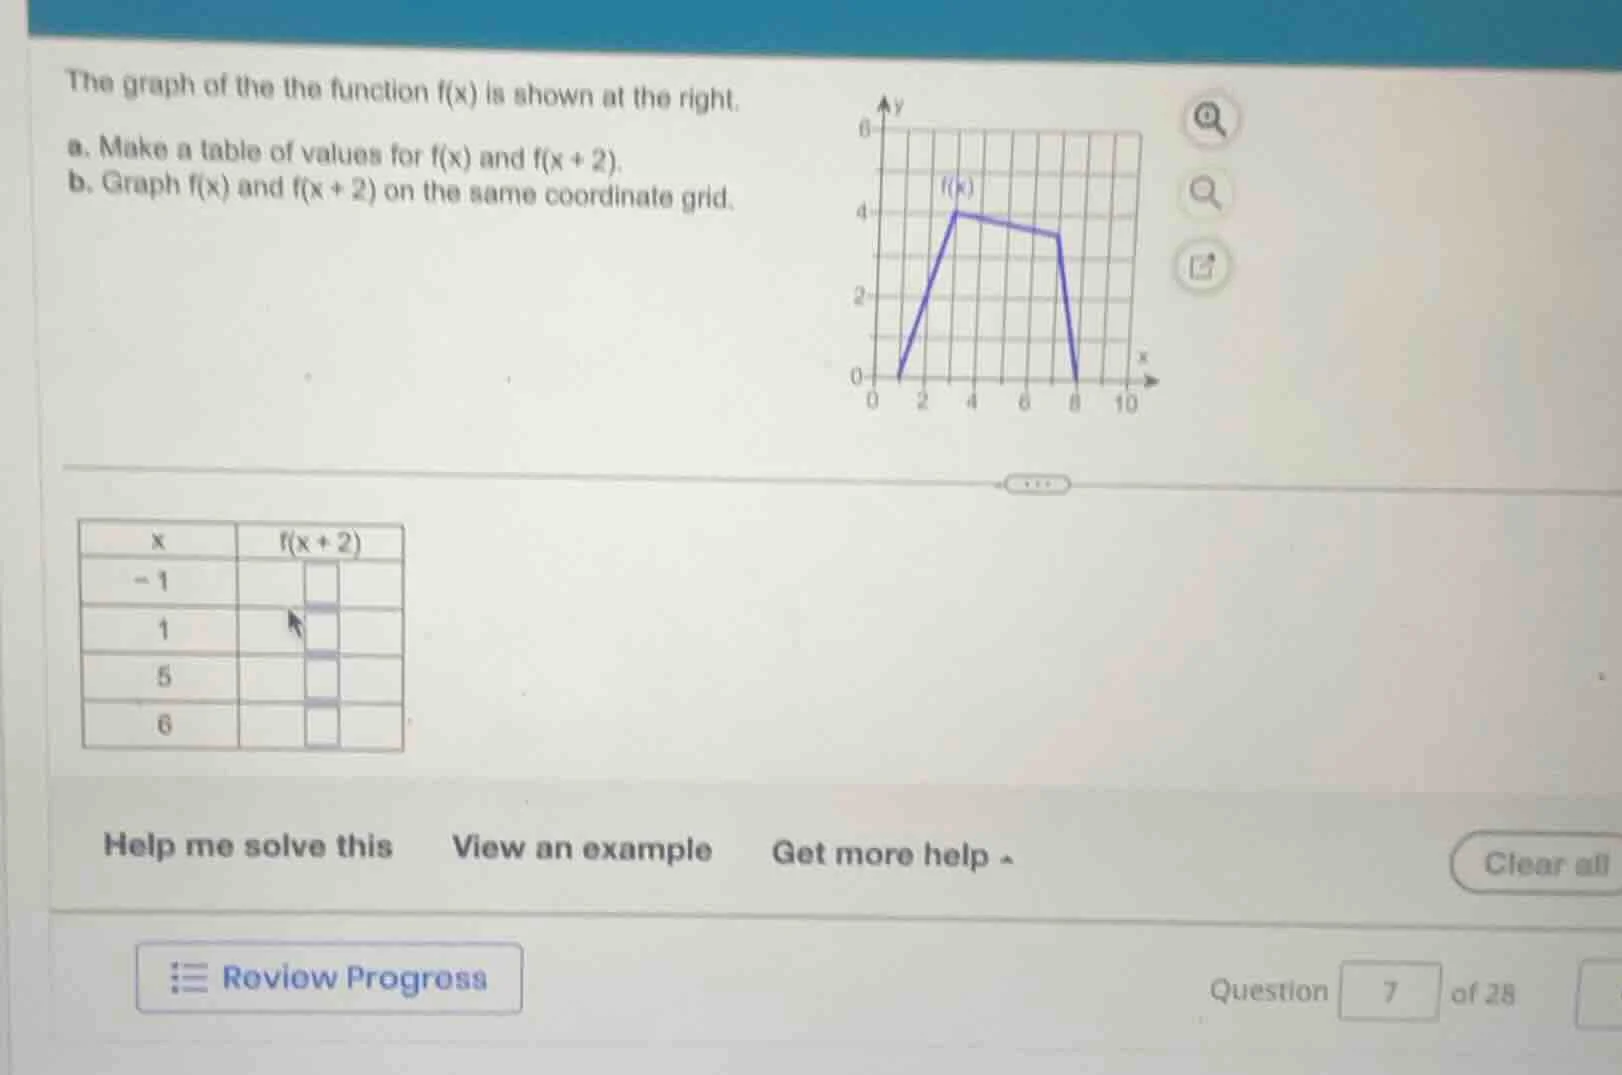
the graph of the the function f(x) is shown at the right.
a. make a table of values for f(x) and f(x + 2).
b. graph f(x) and f(x + 2) on the same coordinate grid.
Part a: Table of Values for \( f(x) \) and \( f(x + 2) \)
First, we analyze the graph of \( f(x) \). From the graph, we can determine the key points of \( f(x) \):
- At \( x = 1 \), \( f(1) = 2 \) (since the graph starts rising from \( (0,0) \) to \( (3,4) \), so at \( x = 1 \), the value is 2)
- At \( x = 3 \), \( f(3) = 4 \)
- At \( x = 7 \), \( f(7) = 4 \)
- At \( x = 8 \), \( f(8) = 0 \)
Wait, actually, let's re-examine the graph. The graph of \( f(x) \) has the following key points:
- From \( (0,0) \) to \( (3,4) \): this is a line segment. So for \( x \) from 0 to 3, \( f(x) = \frac{4}{3}x \) (since slope is \( \frac{4 - 0}{3 - 0} = \frac{4}{3} \))
- From \( (3,4) \) to \( (7,4) \): this is a horizontal line, so \( f(x) = 4 \) for \( x \) from 3 to 7
- From \( (7,4) \) to \( (8,0) \): this is a line segment with slope \( \frac{0 - 4}{8 - 7} = -4 \), so \( f(x) = -4(x - 7) + 4 = -4x + 32 \) for \( x \) from 7 to 8
Now, we need to find \( f(x + 2) \). The function \( f(x + 2) \) is a horizontal shift of \( f(x) \) to the left by 2 units. So the input to \( f \) in \( f(x + 2) \) is \( x + 2 \), so we need to find \( f(x + 2) \) by evaluating \( f \) at \( x + 2 \).
Let's create a table for \( f(x) \) first. Let's list some \( x \)-values and their corresponding \( f(x) \):
| \( x \) | \( f(x) \) |
|---|
| 1 | \( \frac{4}{3}(1) \approx 1.333 \)? Wait, no, maybe the graph is from \( (0,0) \) to \( (3,4) \), so at \( x = 1 \), \( f(1) = \frac{4}{3}(1) \approx 1.33 \), but maybe the grid is such that at \( x = 1 \), it's 2? Wait, the graph is on a grid with \( x \)-axis from 0 to 10 and \( y \)-axis from 0 to 6. Let's look at the coordinates:
- The first segment: from \( (0,0) \) to \( (3,4) \) (since at \( x = 3 \), \( y = 4 \))
- Then horizontal from \( (3,4) \) to \( (7,4) \) (since at \( x = 7 \), \( y = 4 \))
- Then down to \( (8,0) \)
So let's list \( x \) values and \( f(x) \):
- \( x = 0 \): \( f(0) = 0 \)
- \( x = 1 \): \( f(1) = \frac{4}{3}(1) \approx 1.33 \) (but maybe the grid is such that at \( x = 1 \), it's 2? Wait, maybe the graph is from \( (0,0) \) to \( (2,4) \)? Wait, the graph has a point at \( (3,4) \)? Wait, the user's graph shows a point at \( (3,4) \)? Wait, the graph in the image: the \( x \)-axis is from 0 to 10, with grid lines at 0,2,4,6,8,10. The \( y \)-axis is from 0 to 6, with grid lines at 0,2,4,6. The graph of \( f(x) \) starts at \( (0,0) \), rises to \( (3,4) \)? Wait, no, the grid lines are at 2,4,6,8 on the \( x \)-axis. Wait, the \( x \)-axis has ticks at 0,2,4,6,8,10. So the first segment is from \( (0,0) \) to \( (3,4) \)? No, maybe from \( (0,0) \) to \( (2,4) \)? Wait, the graph is drawn from \( (0,0) \) up to \( (3,4) \)? Wait, the user's graph: the blue line starts at \( (0,0) \), goes up to \( (3,4) \)? No, the grid lines are at \( x = 2,4,6,8 \). Wait, maybe the key points are:
- At \( x = 1 \), \( f(1) = 2 \) (since from \( (0,0) \) to \( (3,4) \), at \( x = 1 \), \( y = 2 \); \( x = 2 \), \( y = 4 \)? Wait, maybe the first segment is from \( (0,0) \) to \( (3,4) \), but the grid lines are at \( x = 2,4,6,8 \). Wait, perhaps the graph is:
- From \( (0,0) \) to \( (3,4) \): so at \( x = 0 \), \( f(0) = 0 \); \( x = 3 \), \( f(3) = 4 \)
- Then horizontal from \( (3,4) \) to \( (7,4) \): so at \( x = 3,4,5,6,7 \), \( f(x) = 4 \)
- Then from \( (7,4) \) to \( (8,0) \): so at \( x = 7 \), \( f(7) = 4 \); \( x = 8 \), \( f(8) = 0 \)
Now, we need to find \( f(x + 2) \). So for a given \( x \), \( f(x + 2) \) is the value of \( f \)…

Snap & solve any problem in the app
Get step-by-step solutions on Sovi AI
Photo-based solutions with guided steps
Explore more problems and detailed explanations
Part a: Table of Values for \( f(x) \) and \( f(x + 2) \)
First, we analyze the graph of \( f(x) \). From the graph, we can determine the key points of \( f(x) \):
- At \( x = 1 \), \( f(1) = 2 \) (since the graph starts rising from \( (0,0) \) to \( (3,4) \), so at \( x = 1 \), the value is 2)
- At \( x = 3 \), \( f(3) = 4 \)
- At \( x = 7 \), \( f(7) = 4 \)
- At \( x = 8 \), \( f(8) = 0 \)
Wait, actually, let's re-examine the graph. The graph of \( f(x) \) has the following key points:
- From \( (0,0) \) to \( (3,4) \): this is a line segment. So for \( x \) from 0 to 3, \( f(x) = \frac{4}{3}x \) (since slope is \( \frac{4 - 0}{3 - 0} = \frac{4}{3} \))
- From \( (3,4) \) to \( (7,4) \): this is a horizontal line, so \( f(x) = 4 \) for \( x \) from 3 to 7
- From \( (7,4) \) to \( (8,0) \): this is a line segment with slope \( \frac{0 - 4}{8 - 7} = -4 \), so \( f(x) = -4(x - 7) + 4 = -4x + 32 \) for \( x \) from 7 to 8
Now, we need to find \( f(x + 2) \). The function \( f(x + 2) \) is a horizontal shift of \( f(x) \) to the left by 2 units. So the input to \( f \) in \( f(x + 2) \) is \( x + 2 \), so we need to find \( f(x + 2) \) by evaluating \( f \) at \( x + 2 \).
Let's create a table for \( f(x) \) first. Let's list some \( x \)-values and their corresponding \( f(x) \):
| \( x \) | \( f(x) \) |
|---|
| 1 | \( \frac{4}{3}(1) \approx 1.333 \)? Wait, no, maybe the graph is from \( (0,0) \) to \( (3,4) \), so at \( x = 1 \), \( f(1) = \frac{4}{3}(1) \approx 1.33 \), but maybe the grid is such that at \( x = 1 \), it's 2? Wait, the graph is on a grid with \( x \)-axis from 0 to 10 and \( y \)-axis from 0 to 6. Let's look at the coordinates:
- The first segment: from \( (0,0) \) to \( (3,4) \) (since at \( x = 3 \), \( y = 4 \))
- Then horizontal from \( (3,4) \) to \( (7,4) \) (since at \( x = 7 \), \( y = 4 \))
- Then down to \( (8,0) \)
So let's list \( x \) values and \( f(x) \):
- \( x = 0 \): \( f(0) = 0 \)
- \( x = 1 \): \( f(1) = \frac{4}{3}(1) \approx 1.33 \) (but maybe the grid is such that at \( x = 1 \), it's 2? Wait, maybe the graph is from \( (0,0) \) to \( (2,4) \)? Wait, the graph has a point at \( (3,4) \)? Wait, the user's graph shows a point at \( (3,4) \)? Wait, the graph in the image: the \( x \)-axis is from 0 to 10, with grid lines at 0,2,4,6,8,10. The \( y \)-axis is from 0 to 6, with grid lines at 0,2,4,6. The graph of \( f(x) \) starts at \( (0,0) \), rises to \( (3,4) \)? Wait, no, the grid lines are at 2,4,6,8 on the \( x \)-axis. Wait, the \( x \)-axis has ticks at 0,2,4,6,8,10. So the first segment is from \( (0,0) \) to \( (3,4) \)? No, maybe from \( (0,0) \) to \( (2,4) \)? Wait, the graph is drawn from \( (0,0) \) up to \( (3,4) \)? Wait, the user's graph: the blue line starts at \( (0,0) \), goes up to \( (3,4) \)? No, the grid lines are at \( x = 2,4,6,8 \). Wait, maybe the key points are:
- At \( x = 1 \), \( f(1) = 2 \) (since from \( (0,0) \) to \( (3,4) \), at \( x = 1 \), \( y = 2 \); \( x = 2 \), \( y = 4 \)? Wait, maybe the first segment is from \( (0,0) \) to \( (3,4) \), but the grid lines are at \( x = 2,4,6,8 \). Wait, perhaps the graph is:
- From \( (0,0) \) to \( (3,4) \): so at \( x = 0 \), \( f(0) = 0 \); \( x = 3 \), \( f(3) = 4 \)
- Then horizontal from \( (3,4) \) to \( (7,4) \): so at \( x = 3,4,5,6,7 \), \( f(x) = 4 \)
- Then from \( (7,4) \) to \( (8,0) \): so at \( x = 7 \), \( f(7) = 4 \); \( x = 8 \), \( f(8) = 0 \)
Now, we need to find \( f(x + 2) \). So for a given \( x \), \( f(x + 2) \) is the value of \( f \) at \( x + 2 \).
Let's create a table for \( x = -1, 1, 5, 6 \) (as in the given table for \( f(x + 2) \)):
- For \( x = -1 \):
- \( x + 2 = -1 + 2 = 1 \)
- So \( f(x + 2) = f(1) \). From the graph, at \( x = 1 \), \( f(1) = 2 \) (since the graph is rising from \( (0,0) \) to \( (3,4) \), so at \( x = 1 \), \( y = 2 \))
- Thus, \( f(-1 + 2) = f(1) = 2 \)
- For \( x = 1 \):
- \( x + 2 = 1 + 2 = 3 \)
- \( f(3) = 4 \) (from the horizontal segment)
- Thus, \( f(1 + 2) = f(3) = 4 \)
- For \( x = 5 \):
- \( x + 2 = 5 + 2 = 7 \)
- \( f(7) = 4 \) (from the horizontal segment)
- Thus, \( f(5 + 2) = f(7) = 4 \)
- For \( x = 6 \):
- \( x + 2 = 6 + 2 = 8 \)
- \( f(8) = 0 \) (from the last segment)
- Thus, \( f(6 + 2) = f(8) = 0 \)
So the table for \( f(x + 2) \) is:
| \( x \) | \( f(x + 2) \) |
|---|---|
| 1 | 4 |
| 5 | 4 |
| 6 | 0 |
Part b: Graphing \( f(x) \) and \( f(x + 2) \)
To graph \( f(x + 2) \), we shift the graph of \( f(x) \) 2 units to the left.
- The original graph of \( f(x) \) has key points: \( (0,0) \), \( (3,4) \), \( (7,4) \), \( (8,0) \)
- Shifting these points 2 units to the left (subtract 2 from the \( x \)-coordinate) gives the key points for \( f(x + 2) \): \( (-2, 0) \), \( (1, 4) \), \( (5, 4) \), \( (6, 0) \)
Now, we can graph both functions:
- For \( f(x) \): plot \( (0,0) \), \( (3,4) \), \( (7,4) \), \( (8,0) \) and draw the segments between them.
- For \( f(x + 2) \): plot \( (-2, 0) \), \( (1, 4) \), \( (5, 4) \), \( (6, 0) \) and draw the segments between them.
Final Table for Part a
| \( x \) | \( f(x + 2) \) |
|---|---|
| 1 | 4 |
| 5 | 4 |
| 6 | 0 |
(Note: The table in the problem might have a typo or missing \( x \)-values, but based on the given \( x \)-values (-1, 1, 5, 6), we calculated \( f(x + 2) \) as above.)