QUESTION IMAGE
Question
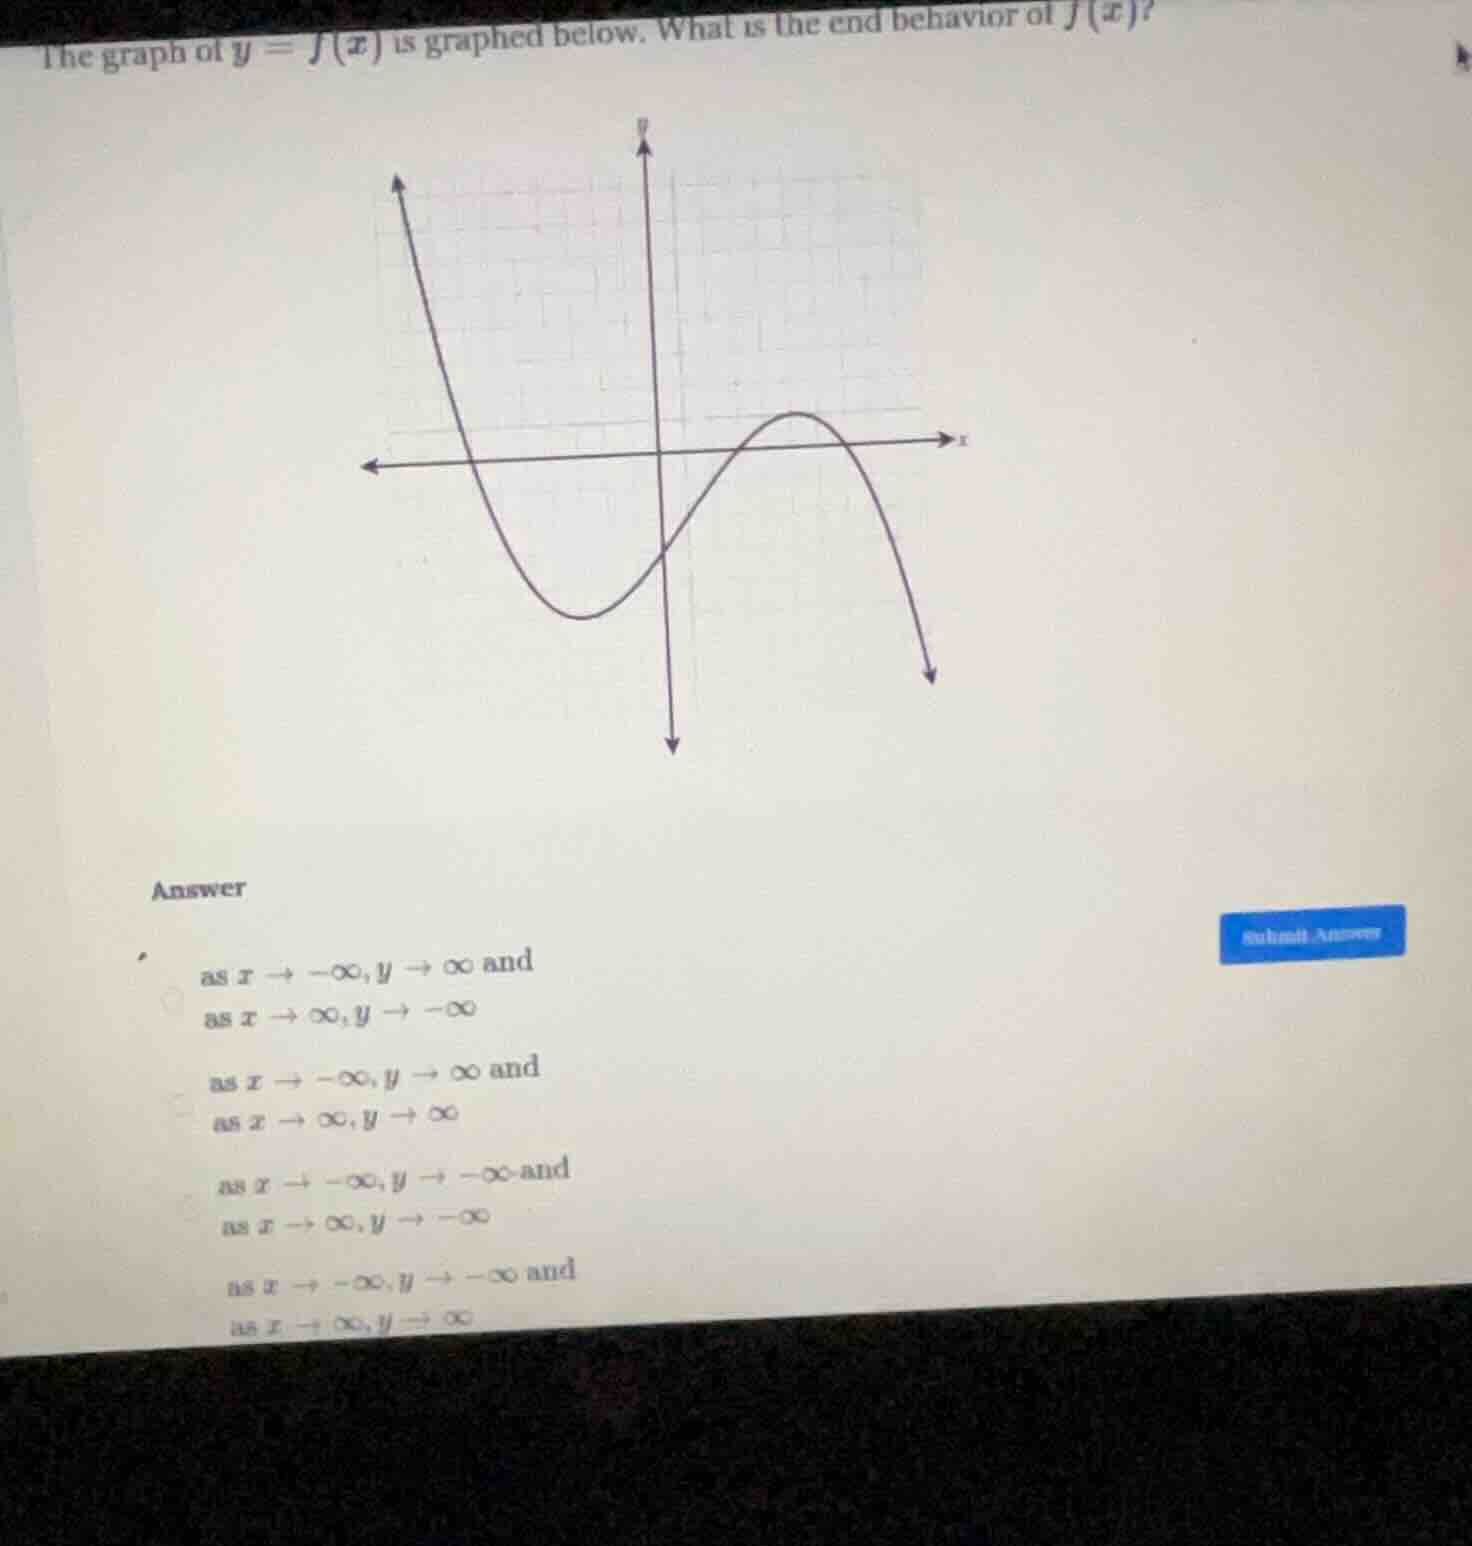
the graph of ( y = f(x) ) is graphed below. what is the end behavior of ( f(x) )?
answer
as ( x \to -infty ), ( y \to infty ) and
as ( x \to infty ), ( y \to -infty )
as ( x \to -infty ), ( y \to infty ) and
as ( x \to infty ), ( y \to infty )
as ( x \to -infty ), ( y \to -infty ) and
as ( x \to infty ), ( y \to -infty )
as ( x \to -infty ), ( y \to -infty ) and
as ( x \to infty ), ( y \to infty )
Step1: Analyze left end behavior
Observe the graph as \( x \to -\infty \). The left - most part of the graph is going upwards, so as \( x \) approaches negative infinity (\( x\to-\infty \)), the value of \( y = f(x) \) approaches positive infinity (\( y\to\infty \)).
Step2: Analyze right end behavior
Observe the graph as \( x \to \infty \). The right - most part of the graph is going downwards, so as \( x \) approaches positive infinity (\( x\to\infty \)), the value of \( y = f(x) \) approaches negative infinity (\( y\to-\infty \)).

Snap & solve any problem in the app
Get step-by-step solutions on Sovi AI
Photo-based solutions with guided steps
Explore more problems and detailed explanations
as \( x \to -\infty \), \( y \to \infty \) and as \( x \to \infty \), \( y \to -\infty \)