QUESTION IMAGE
Question
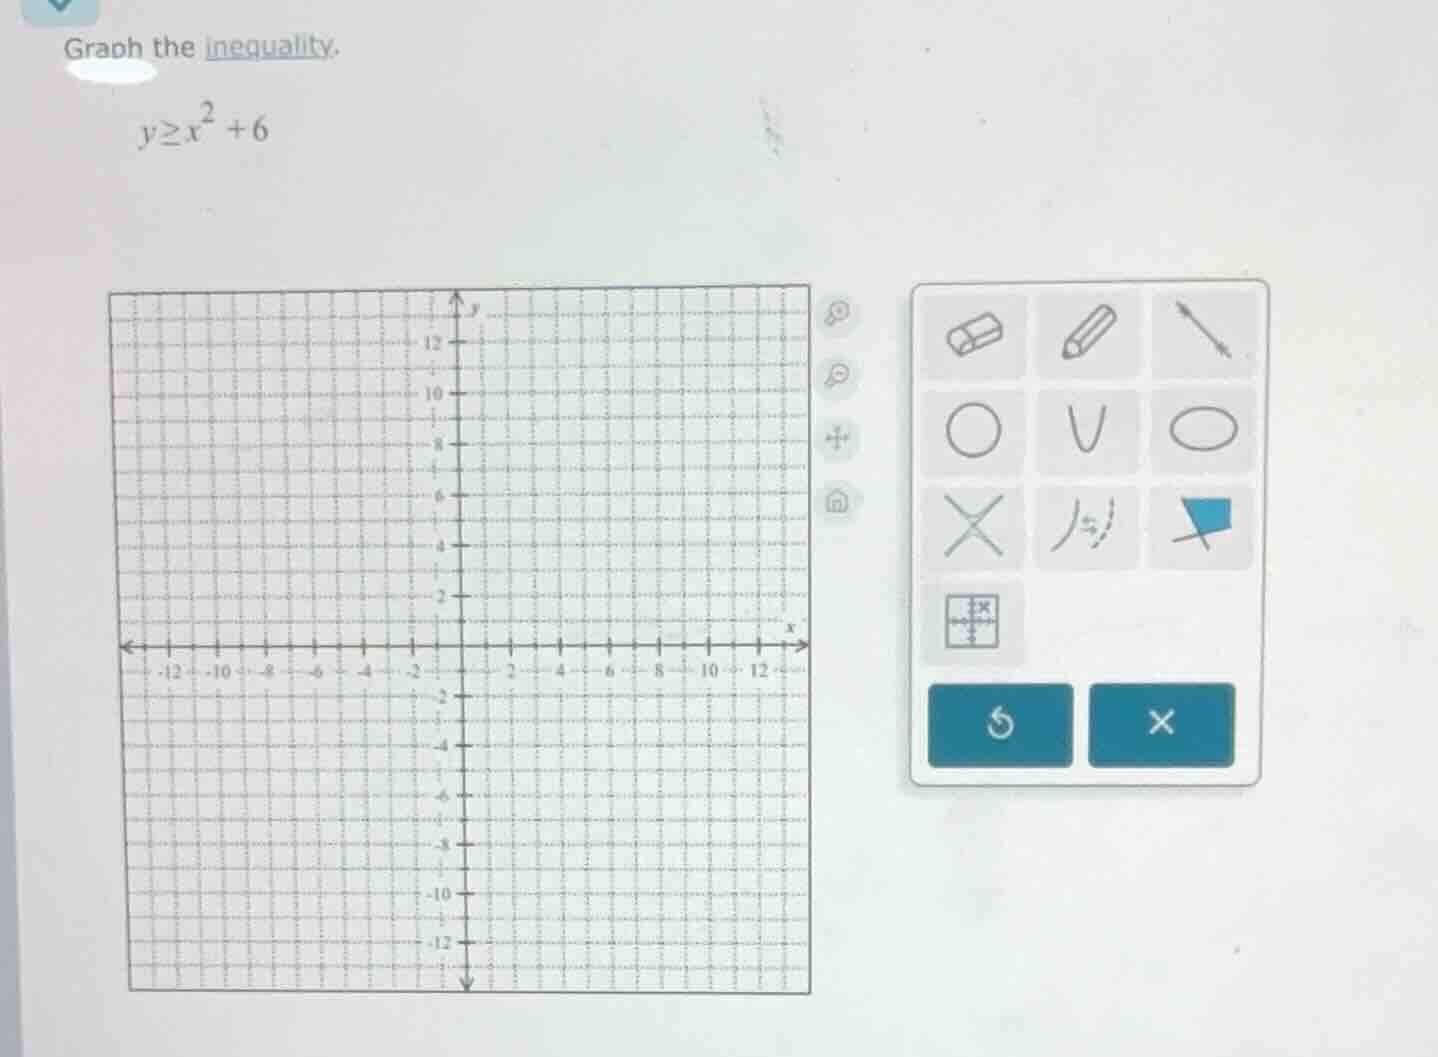
graph the inequality.
y≥x² +6
Step1: Identify the boundary curve
The boundary is $y = x^2 + 6$, a parabola opening upward with vertex at $(0,6)$. Since the inequality is $\geq$, we use a solid line for the boundary.
Step2: Plot the vertex and key points
Vertex: $(0, 6)$.
For $x=2$: $y = 2^2 + 6 = 10$, so point $(2,10)$.
For $x=-2$: $y = (-2)^2 + 6 = 10$, so point $(-2,10)$.
For $x=3$: $y = 3^2 + 6 = 15$, so point $(3,15)$.
For $x=-3$: $y = (-3)^2 + 6 = 15$, so point $(-3,15)$.
Step3: Shade the solution region
Test the point $(0,0)$: $0 \geq 0^2 + 6$ simplifies to $0 \geq 6$, which is false. So we shade the region above the parabola (all points where $y$ is greater than or equal to the parabola's values).

Snap & solve any problem in the app
Get step-by-step solutions on Sovi AI
Photo-based solutions with guided steps
Explore more problems and detailed explanations
- Draw a solid upward-opening parabola with vertex at $(0,6)$, passing through points like $(\pm2,10)$ and $(\pm3,15)$.
- Shade the entire area above and including this parabola.