QUESTION IMAGE
Question
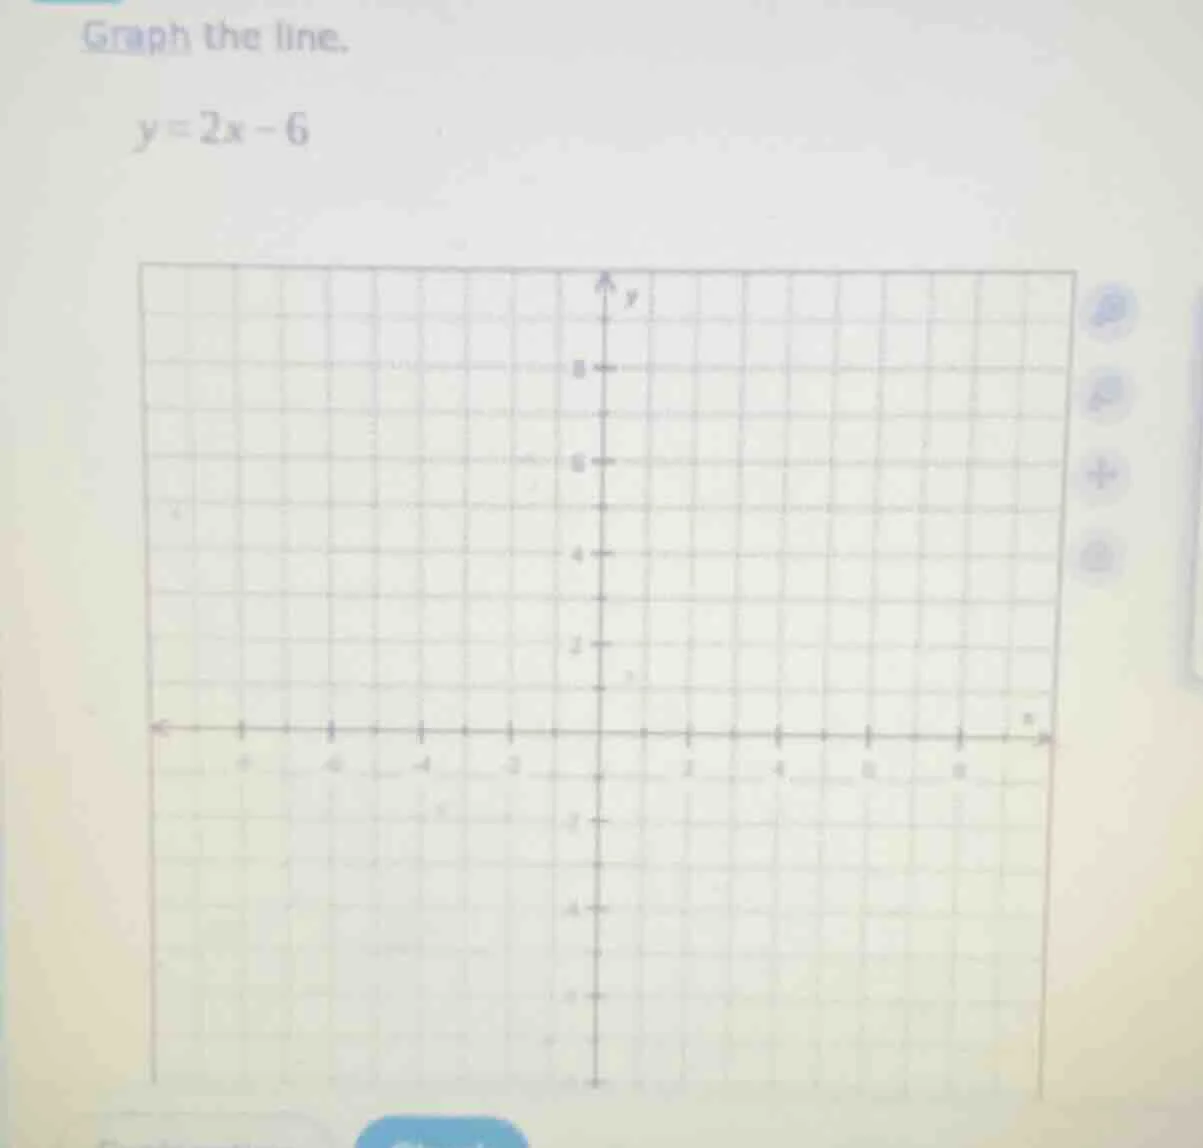
graph the line.
y = 2x - 6
Step1: Identify the slope and y-intercept
The equation \( y = 2x - 6 \) is in slope - intercept form \( y=mx + b \), where \( m \) is the slope and \( b \) is the y - intercept. Here, \( m = 2=\frac{2}{1}\) and \( b=-6\).
Step2: Plot the y - intercept
The y - intercept is \( b = - 6 \), so we plot the point \( (0,-6) \) on the y - axis.
Step3: Use the slope to find another point
The slope \( m=\frac{2}{1}\) means that for every 1 unit we move to the right (increase in \( x \) by 1), we move up 2 units (increase in \( y \) by 2). Starting from \( (0,-6) \), if we move \( x = 1 \) unit to the right (to \( x = 1 \)), then \( y=-6 + 2=-4 \). So we can plot the point \( (1,-4) \). We can also move to the left: for a decrease in \( x \) by 1 ( \( x=- 1 \) ), \( y=-6-2=-8 \), so the point \( (-1,-8) \) can be plotted.
Step4: Draw the line
After plotting two or more points (e.g., \( (0,-6) \), \( (1,-4) \), \( (-1,-8) \)), we draw a straight line passing through these points.
To graph the line \( y = 2x-6 \):
- Plot the y - intercept at \( (0,-6) \).
- Use the slope \( 2 \) (rise 2, run 1) to find additional points (e.g., \( (1,-4) \), \( (-1,-8) \)).
- Draw a straight line through the plotted points.

Snap & solve any problem in the app
Get step-by-step solutions on Sovi AI
Photo-based solutions with guided steps
Explore more problems and detailed explanations
Step1: Identify the slope and y-intercept
The equation \( y = 2x - 6 \) is in slope - intercept form \( y=mx + b \), where \( m \) is the slope and \( b \) is the y - intercept. Here, \( m = 2=\frac{2}{1}\) and \( b=-6\).
Step2: Plot the y - intercept
The y - intercept is \( b = - 6 \), so we plot the point \( (0,-6) \) on the y - axis.
Step3: Use the slope to find another point
The slope \( m=\frac{2}{1}\) means that for every 1 unit we move to the right (increase in \( x \) by 1), we move up 2 units (increase in \( y \) by 2). Starting from \( (0,-6) \), if we move \( x = 1 \) unit to the right (to \( x = 1 \)), then \( y=-6 + 2=-4 \). So we can plot the point \( (1,-4) \). We can also move to the left: for a decrease in \( x \) by 1 ( \( x=- 1 \) ), \( y=-6-2=-8 \), so the point \( (-1,-8) \) can be plotted.
Step4: Draw the line
After plotting two or more points (e.g., \( (0,-6) \), \( (1,-4) \), \( (-1,-8) \)), we draw a straight line passing through these points.
To graph the line \( y = 2x-6 \):
- Plot the y - intercept at \( (0,-6) \).
- Use the slope \( 2 \) (rise 2, run 1) to find additional points (e.g., \( (1,-4) \), \( (-1,-8) \)).
- Draw a straight line through the plotted points.