QUESTION IMAGE
Question
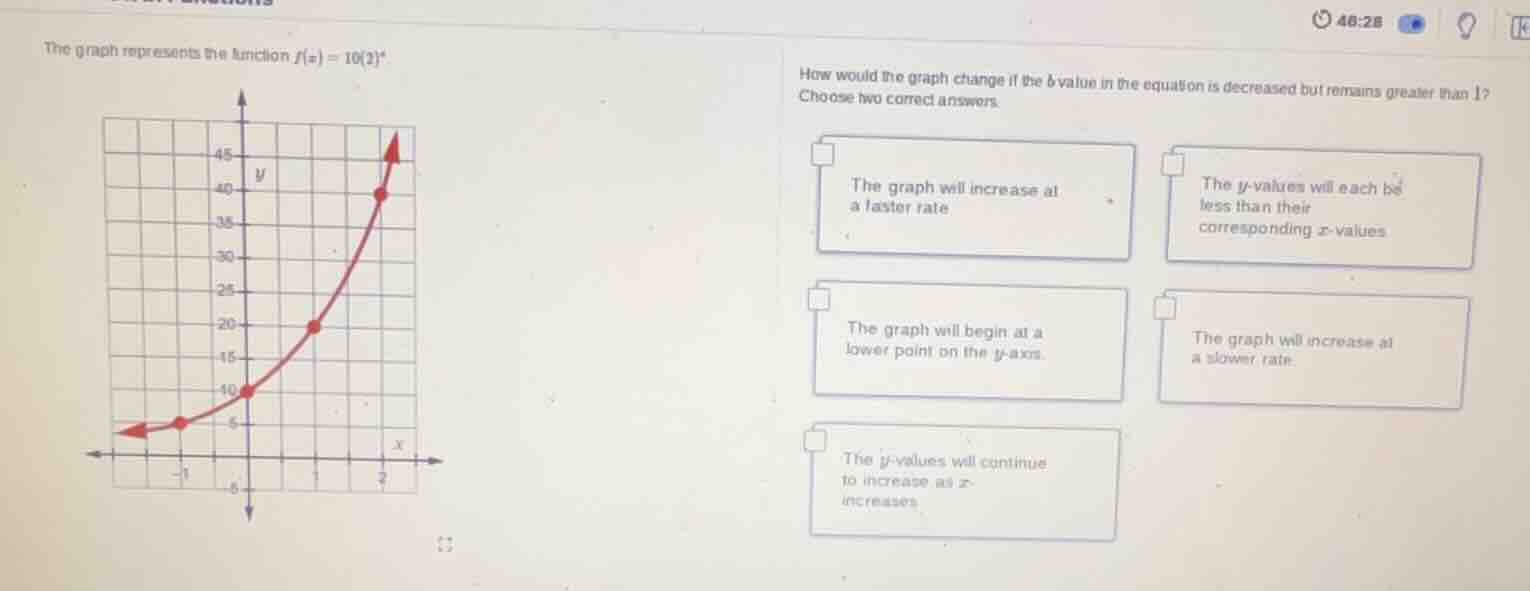
the graph represents the function $f(x)=10(2)^x$
how would the graph change if the $b$-value in the equation is decreased but remains greater than 1?
choose two correct answers.
the graph will increase at a faster rate
the $y$-values will each be less than their corresponding $x$-values
the graph will begin at a lower point on the $y$-axis.
the graph will increase at a slower rate
the $y$-values will continue to increase as $x$ increases
The function is an exponential growth function of the form $f(x)=a(b)^x$ where $a=10>0$ and original $b=2>1$. When $b$ is decreased but remains greater than 1:
- Since $b$ is still above 1, the function remains an increasing exponential function, so $y$-values keep rising as $x$ increases.
- A smaller $b$ (still $>1$) means the growth rate is reduced, so the graph increases slower.
- For positive $x$, a smaller $b$ leads to smaller $y$-values than the original function at the same $x$.
- The $y$-intercept is $f(0)=10(b)^0=10$, so it does not change.
We need to select two correct options from the choices.

Snap & solve any problem in the app
Get step-by-step solutions on Sovi AI
Photo-based solutions with guided steps
Explore more problems and detailed explanations
- The y-values will each be less than their corresponding x-values
- The graph will increase at a slower rate
- The y-values will continue to increase as x increases
Note: Based on standard exponential growth properties, all three above are correct, but if only two are to be chosen, the most direct changes related to the reduced $b$ are:
- The graph will increase at a slower rate
- The y-values will each be less than their corresponding x-values