QUESTION IMAGE
Question
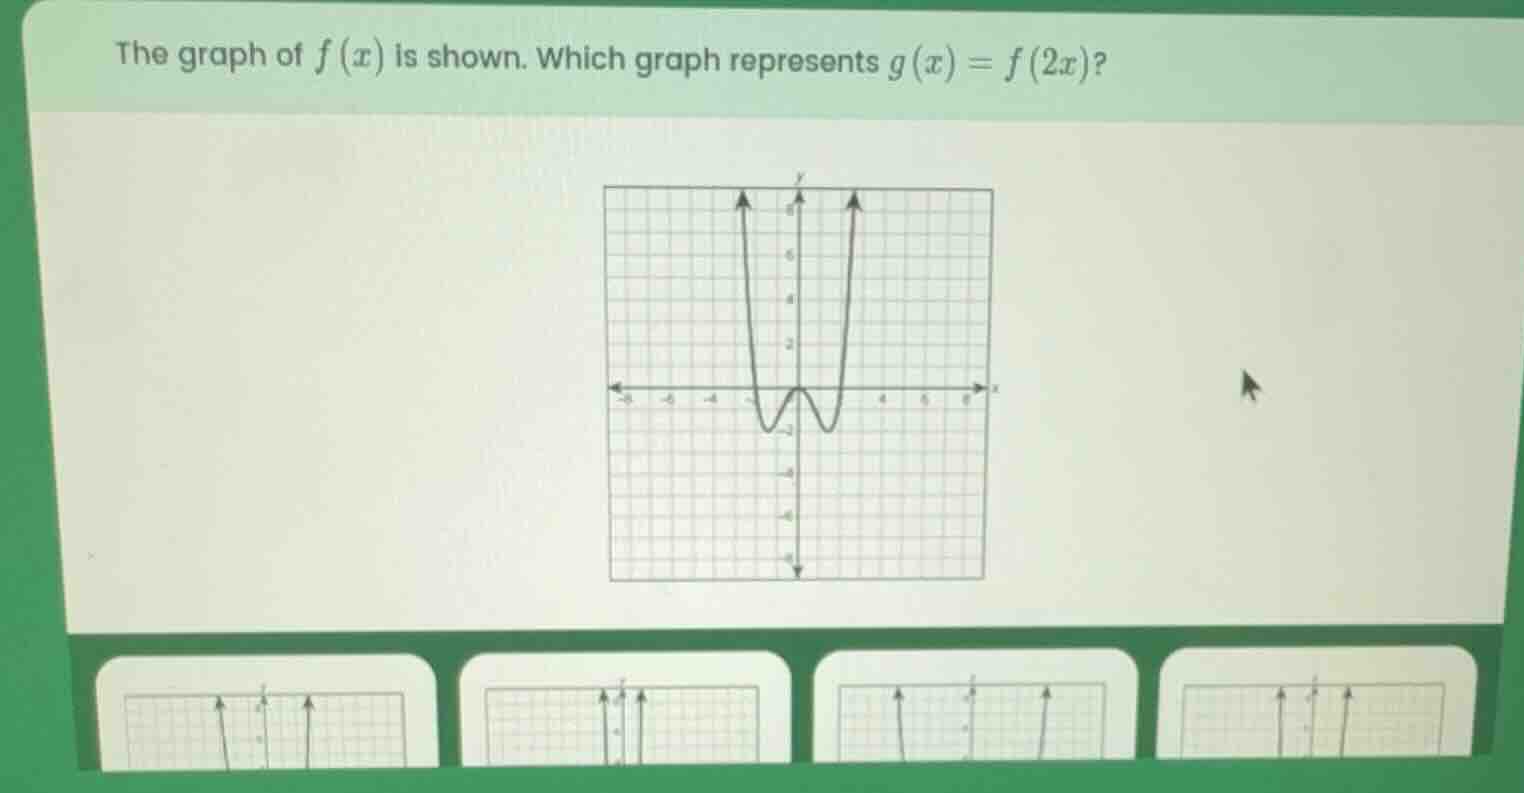
the graph of $f(x)$ is shown. which graph represents $g(x)=f(2x)$? (graph of $f(x)$ is shown, and there are four option graphs below)
Step1: Identify horizontal transformation rule
For $g(x)=f(kx)$ where $k>1$, the graph of $f(x)$ is horizontally compressed by a factor of $\frac{1}{k}$. Here $k=2$, so compress by $\frac{1}{2}$.
Step2: Apply to key points
Take key points of $f(x)$: e.g., $x$-intercepts at $x=\pm2$, minima at $x=\pm1$. Compress $x$-coordinates: $\pm2 \times \frac{1}{2}=\pm1$, $\pm1 \times \frac{1}{2}=\pm0.5$. The $y$-values stay unchanged.
Step3: Match to options
The correct graph will have $x$-intercepts at $\pm1$, minima at $\pm0.5$, same vertical shape as $f(x)$, just narrower horizontally. This corresponds to the second option from the left (the graph with the compressed parabola-like shape, symmetric over y-axis, with intercepts closer to the origin than the original).

Snap & solve any problem in the app
Get step-by-step solutions on Sovi AI
Photo-based solutions with guided steps
Explore more problems and detailed explanations
The second graph from the left (the graph that is a horizontal compression of $f(x)$ by a factor of $\frac{1}{2}$, with key $x$-coordinates halved while $y$-coordinates remain the same)