QUESTION IMAGE
Question
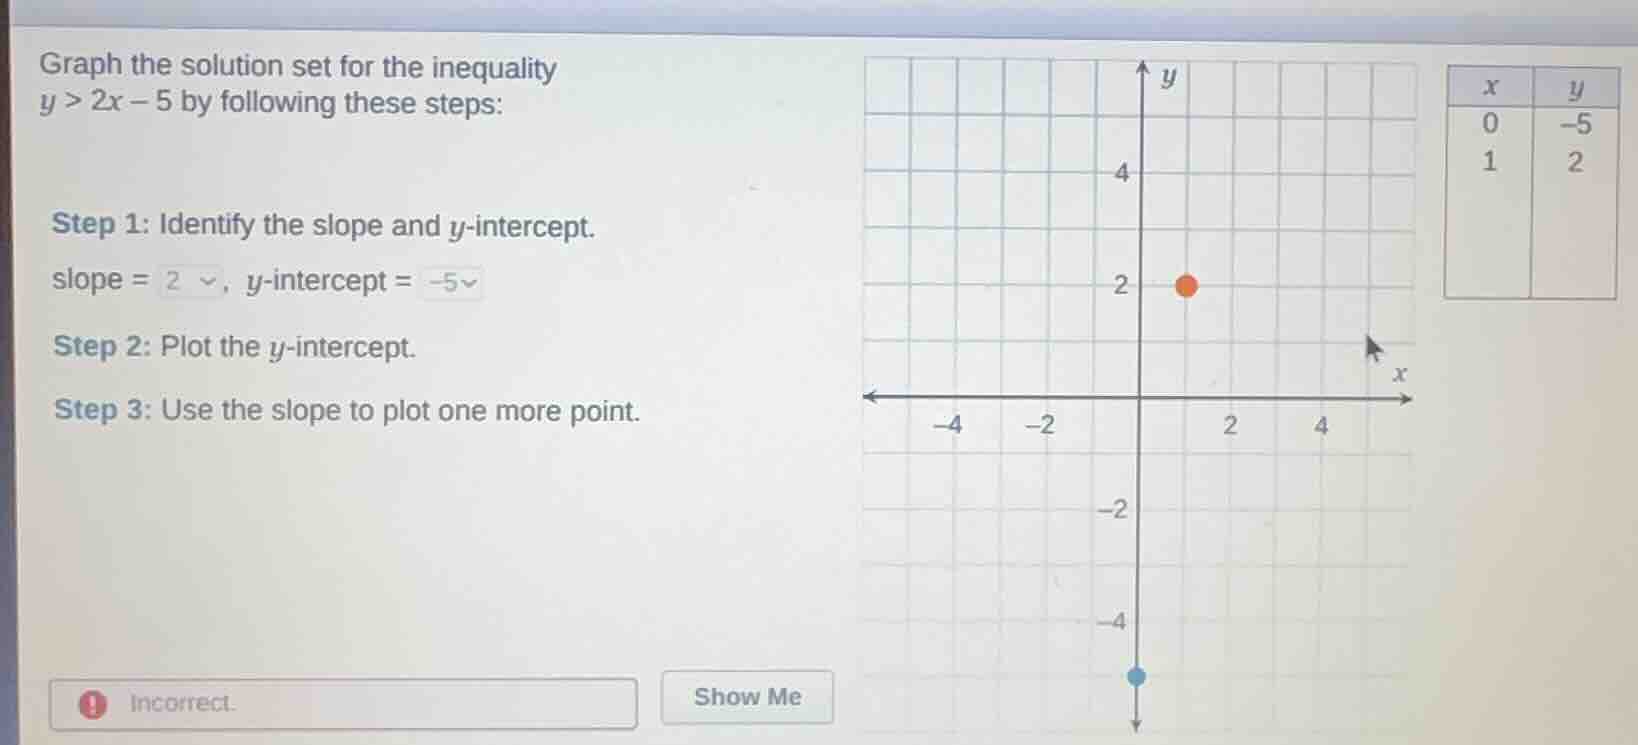
graph the solution set for the inequality y > 2x - 5 by following these steps: step 1: identify the slope and y-intercept. slope = 2, y-intercept = -5 step 2: plot the y-intercept. step 3: use the slope to plot one more point.
Step 1: Recall the slope - intercept form
The slope - intercept form of a linear equation is $y = mx + b$, where $m$ is the slope and $b$ is the $y$-intercept. For the inequality $y>2x - 5$, the corresponding linear equation is $y = 2x-5$. So, the slope $m = 2$ (which can be written as $\frac{2}{1}$) and the $y$-intercept $b=- 5$.
Step 2: Plot the $y$-intercept
The $y$-intercept is the point where $x = 0$. So, we plot the point $(0,-5)$ on the coordinate plane.
Step 3: Use the slope to find another point
The slope is $\frac{\text{rise}}{\text{run}}=\frac{2}{1}$. Starting from the $y$-intercept $(0,-5)$, we move up 2 units (because the numerator of the slope is 2, positive means up) and then 1 unit to the right (because the denominator of the slope is 1, positive means right). So, from $(0,-5)$, moving up 2 units gives $y=-5 + 2=-3$ and moving right 1 unit gives $x = 0+1 = 1$. So, the new point is $(1,-3)$.
Step 4: Draw the boundary line and shade the region
Since the inequality is $y>2x - 5$ (the symbol is $>$ and not $\geq$), we draw a dashed line through the points $(0,-5)$ and $(1,-3)$ (a dashed line indicates that the points on the line are not included in the solution set). Then, we shade the region above the line because we want all the points where $y$ is greater than $2x - 5$.

Snap & solve any problem in the app
Get step-by-step solutions on Sovi AI
Photo-based solutions with guided steps
Explore more problems and detailed explanations
To graph $y>2x - 5$:
- Plot the $y$-intercept $(0,-5)$.
- Use the slope $2=\frac{2}{1}$ to find another point: from $(0,-5)$, move up 2 units and right 1 unit to get $(1,-3)$.
- Draw a dashed line through $(0,-5)$ and $(1,-3)$.
- Shade the region above the dashed line.