QUESTION IMAGE
Question
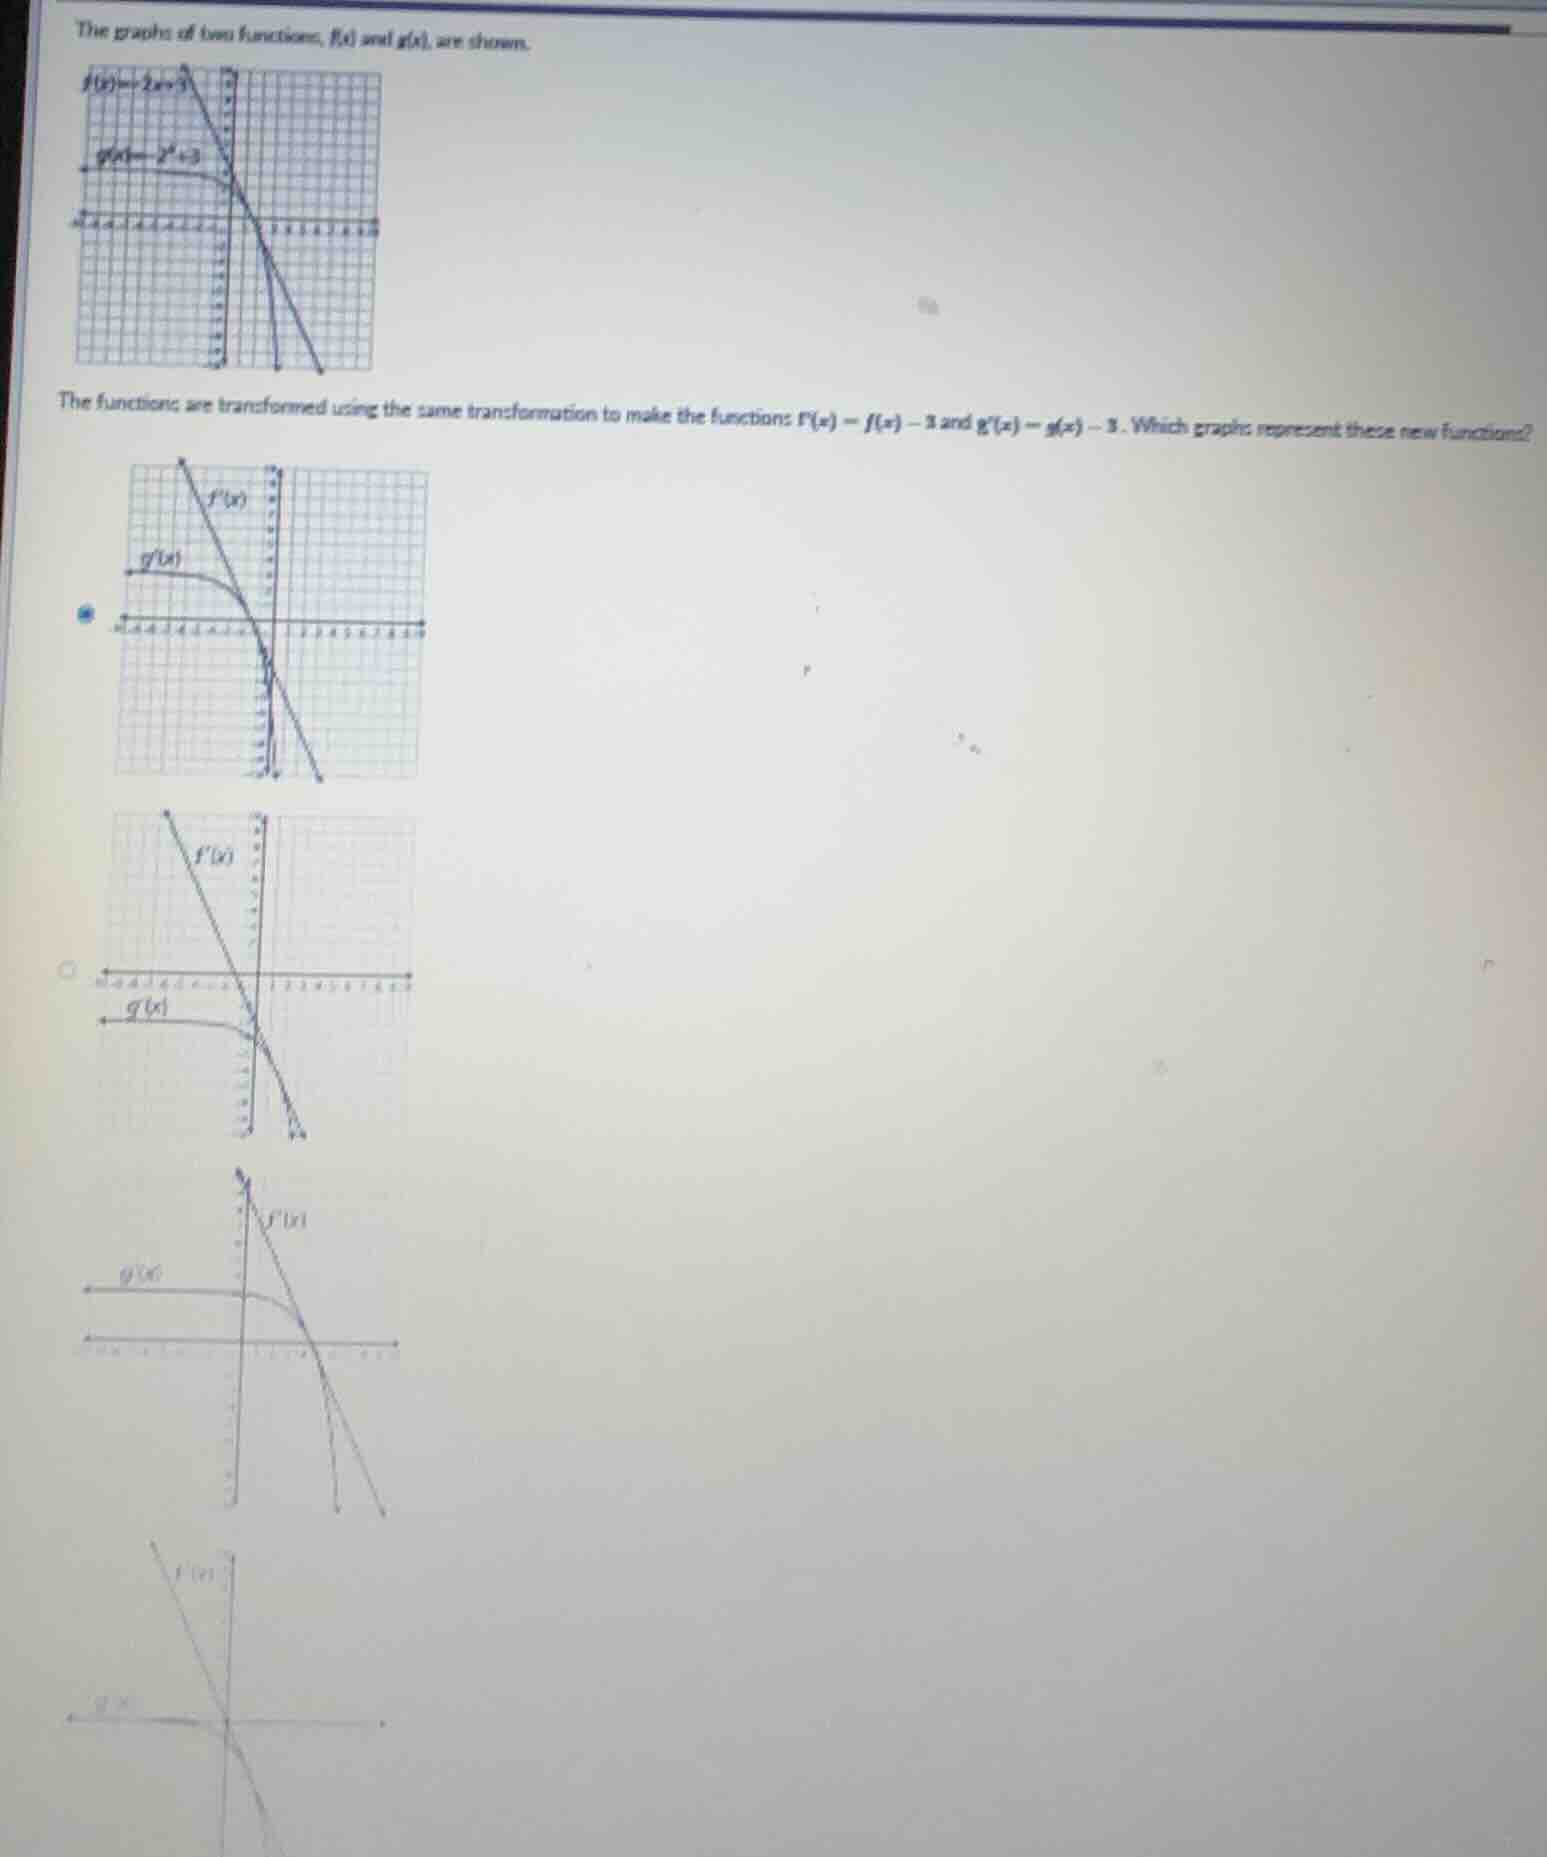
the graphs of two functions, f(x) and g(x), are shown.
the functions are transformed using the same transformation to make the functions: f(x) = f(x) - 3 and g(x) = g(x) - 3. which graph represents these new functions?
options with graphs omitted
Step1: Analyze the transformation
The transformation is \( F(x)=f(x) - 3 \) and \( G(x)=g(x)-3 \), which is a vertical shift down by 3 units for both functions.
Step2: Check the original functions
Original \( f(x)= - 2x + 5 \) (assuming slope -2 and y - intercept 5) and \( g(x)=2^{-x}+3 \) (exponential function with y - intercept 4 when \( x = 0 \), since \( 2^{0}=1,1 + 3=4 \)).
After shifting down by 3:
- For \( f(x) \): The new function \( F(x)=-2x + 5-3=-2x + 2 \). The y - intercept changes from 5 to 2.
- For \( g(x) \): The new function \( G(x)=2^{-x}+3 - 3=2^{-x} \). The y - intercept changes from 4 to 1 (when \( x = 0 \), \( 2^{0}=1 \)).
Now, we look for the graph where both \( F(x) \) (a line with y - intercept 2) and \( G(x) \) (an exponential function with y - intercept 1) are shifted down by 3. The second graph (the one with \( F(x) \) and \( G(x) \) where \( G(x) \) has y - intercept 1 and \( F(x) \) has y - intercept 2) should be the correct one. (Assuming the second option in the list of graphs is the one with these characteristics. Since the first graph has \( G(x) \) with y - intercept still around 4 - 3? No, wait, original \( g(x) \) had y - intercept 4, after shifting down 3, it should be 1. The second graph shows \( G(x) \) with y - intercept 1 and \( F(x) \) with y - intercept 2, which matches our calculation.)

Snap & solve any problem in the app
Get step-by-step solutions on Sovi AI
Photo-based solutions with guided steps
Explore more problems and detailed explanations
The graph (the second option among the given graphs, with \( F(x) \) as a line with y - intercept 2 and \( G(x) \) as an exponential curve with y - intercept 1) represents the new functions \( F(x)=f(x)-3 \) and \( G(x)=g(x)-3 \). (If we assume the options are labeled, for example, if the second graph is labeled as B, then the answer is B. But since the exact labels are not clear from the text, we describe the correct graph based on the transformation: the graph where both \( f(x) \) (line) and \( g(x) \) (exponential) are shifted down by 3 units, so the line has y - intercept 2 and the exponential has y - intercept 1.)