QUESTION IMAGE
Question
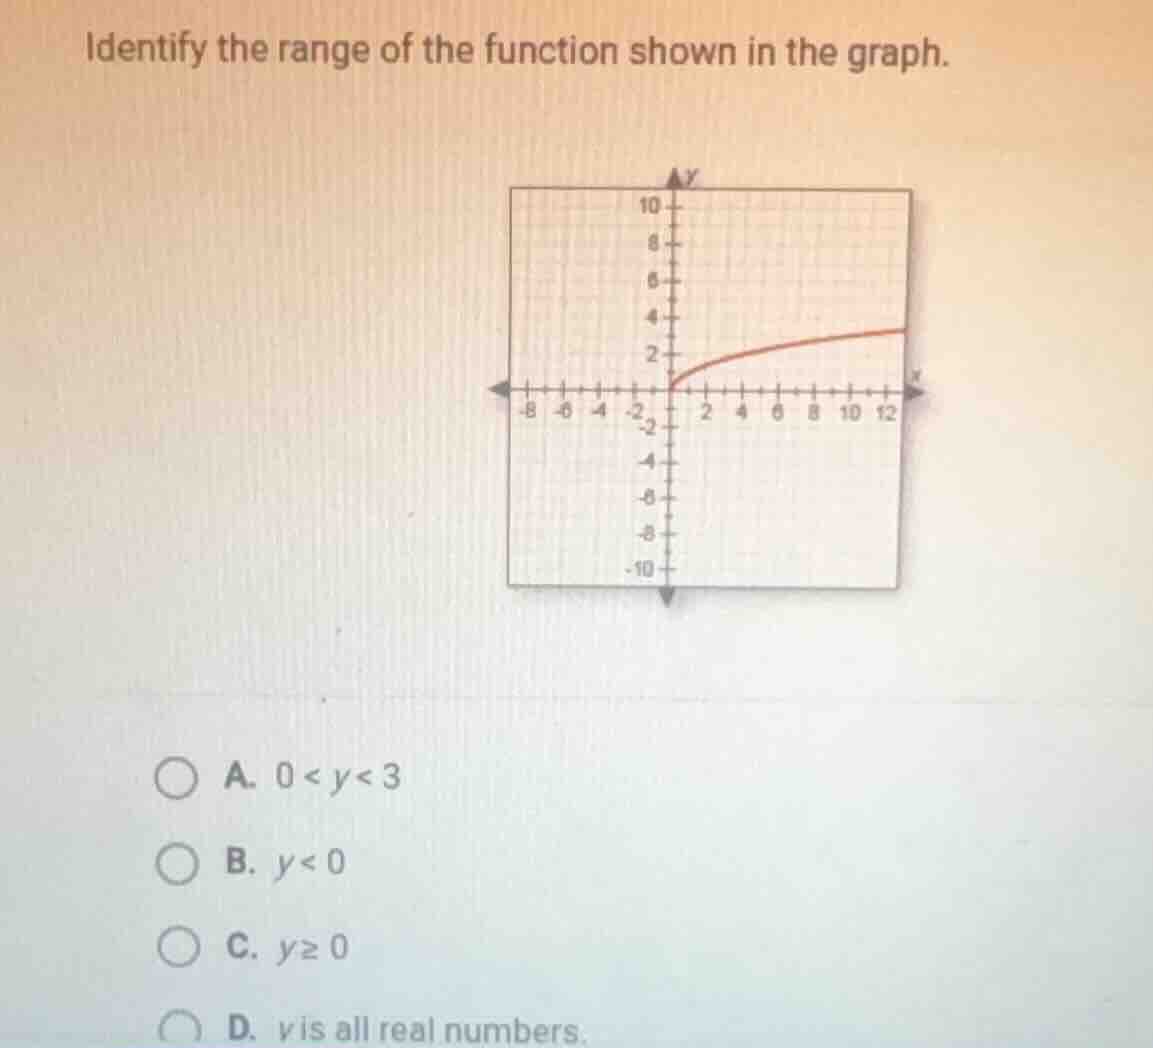
identify the range of the function shown in the graph. a. $0 < y < 3$ b. $y < 0$ c. $y geq 0$ d. $y$ is all real numbers.
Step1: Recall the definition of range
The range of a function is the set of all possible output values (y - values) the function can take.
Step2: Analyze the graph
Looking at the given graph, the curve starts at the origin \((0,0)\) and then increases (or stays at or above \(y = 0\)) as \(x\) increases. There are no points on the graph where \(y\) is negative. The \(y\) - values start from \(y=0\) (including \(y = 0\)) and go upwards.
Step3: Evaluate the options
- Option A: \(0\lt y\lt3\) is incorrect because the graph includes \(y = 0\) and also \(y\) can be equal to or greater than \(0\) and may go beyond \(3\) as \(x\) increases.
- Option B: \(y\lt0\) is incorrect because the graph has no points with \(y\) - values less than \(0\).
- Option C: \(y\geq0\) is correct because the graph starts at \((0,0)\) and all the \(y\) - values of the graph are greater than or equal to \(0\).
- Option D: \(y\) is all real numbers is incorrect because the graph has no negative \(y\) - values, so \(y\) cannot be all real numbers.

Snap & solve any problem in the app
Get step-by-step solutions on Sovi AI
Photo-based solutions with guided steps
Explore more problems and detailed explanations
C. \(y\geq0\)