QUESTION IMAGE
Question
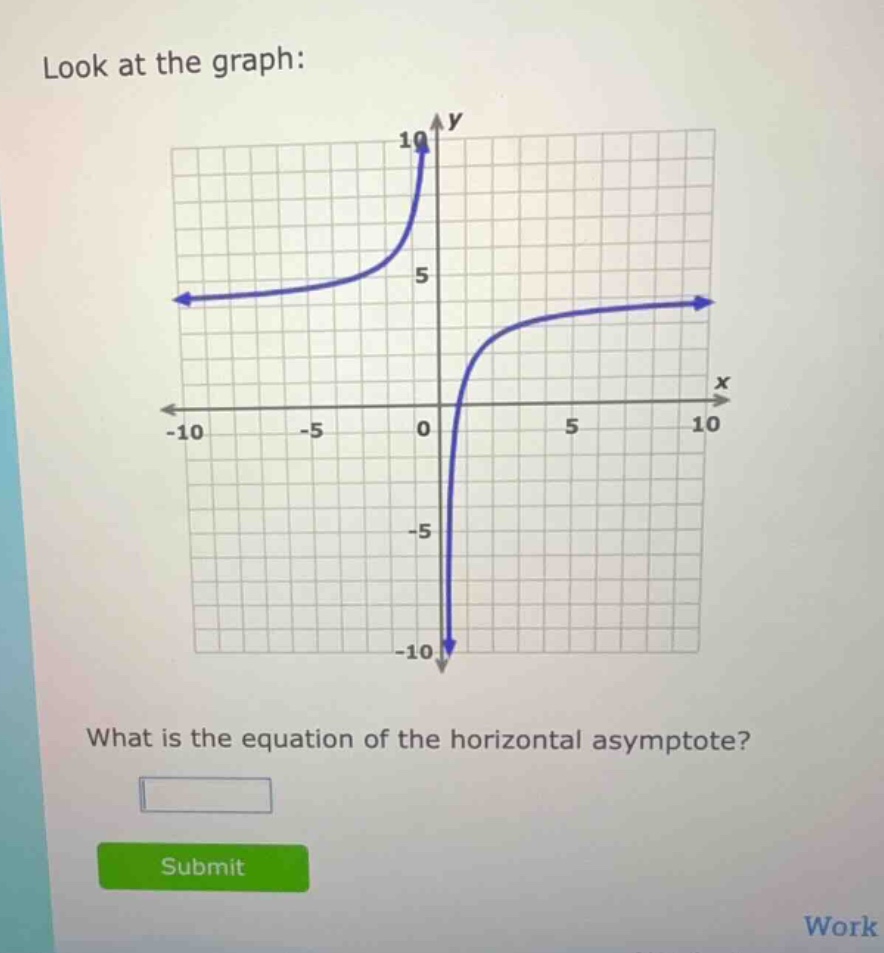
look at the graph: what is the equation of the horizontal asymptote? submit work
Step1: Recall horizontal asymptote definition
A horizontal asymptote is a horizontal line \( y = k \) that the graph approaches as \( x \to \pm\infty \).
Step2: Analyze the graph for \( x \to \pm\infty \)
- As \( x \to +\infty \), the right - hand part of the graph approaches a horizontal line.
- As \( x \to -\infty \), the left - hand part of the graph also approaches the same horizontal line.
- From the graph, we can see that as \( x \) becomes very large (positive or negative), the \( y \) - value of the graph approaches \( y = 3 \)? Wait, no, wait. Wait, looking at the graph, the left - hand curve approaches a horizontal line around \( y = 3 \)? Wait, no, wait the grid: each square is 1 unit. Wait, the left curve as \( x\to-\infty\) is approaching a horizontal line, and the right curve as \( x\to+\infty\) is also approaching the same horizontal line. Wait, looking at the graph, the horizontal line that both branches approach is \( y = 3 \)? No, wait, let's check the \( y\) - axis. Wait, the left curve is above the \( x\) - axis, and the right curve is above the \( x\) - axis? Wait no, the right curve starts from below? Wait no, the graph: the left part (for \( x<0\)) has a curve that as \( x\to-\infty\) is approaching a horizontal line, and as \( x\) approaches 0 from the left, it goes up to \( y = 10\). The right part (for \( x > 0\)) as \( x\to+\infty\) approaches a horizontal line, and as \( x\) approaches 0 from the right, it goes down to \( y=- 10\). Wait, but the horizontal asymptote: when \( x\to+\infty\), the right curve approaches \( y = 3\)? No, wait, looking at the grid, the horizontal line that both the left and right curves approach is \( y = 3\)? Wait, no, maybe I made a mistake. Wait, no, let's look again. Wait, the left curve (for \( x<0\)) is approaching a horizontal line, and the right curve (for \( x>0\)) is also approaching the same horizontal line. Let's check the \( y\) - value: the left curve, as \( x\to-\infty\), is at \( y\approx3\)? Wait, no, the grid: the horizontal line that the graph approaches as \( x\to\pm\infty\) is \( y = 3\)? Wait, no, maybe \( y = 3\) is wrong. Wait, let's see the \( y\) - axis: the left curve is above the \( x\) - axis, and the right curve is above the \( x\) - axis? Wait, no, the right curve starts from below the \( x\) - axis? Wait, no, the graph shows that for \( x>0\), the curve comes from below (near \( x = 0\), \( y\) is negative) and then rises to approach a horizontal line. For \( x<0\), the curve comes from above (near \( x = 0\), \( y\) is positive) and then levels off to a horizontal line. Wait, but the horizontal asymptote: when \( x\to+\infty\), the right curve approaches \( y = 3\), and when \( x\to-\infty\), the left curve approaches \( y = 3\)? Wait, no, maybe the horizontal asymptote is \( y = 3\)? Wait, no, let's count the grid. Each square is 1 unit. The left curve, as \( x\to-\infty\), is at \( y = 3\)? Wait, no, the left curve is at \( y = 3\) when \( x\to-\infty\), and the right curve is at \( y = 3\) when \( x\to+\infty\). Wait, actually, looking at the graph, the horizontal asymptote is \( y = 3\)? No, wait, maybe \( y = 3\) is incorrect. Wait, let's look again. The left - hand curve (for \( x<0\)) is approaching a horizontal line, and the right - hand curve (for \( x>0\)) is also approaching the same horizontal line. Let's check the \( y\) - value: the horizontal line is \( y = 3\)? Wait, no, maybe \( y = 3\) is wrong. Wait, the correct horizontal asymptote: from the graph, when \( x\to+\infty\), the right curve approaches \( y = 3\), and when \(…

Snap & solve any problem in the app
Get step-by-step solutions on Sovi AI
Photo-based solutions with guided steps
Explore more problems and detailed explanations
\( y = 3\)