QUESTION IMAGE
Question
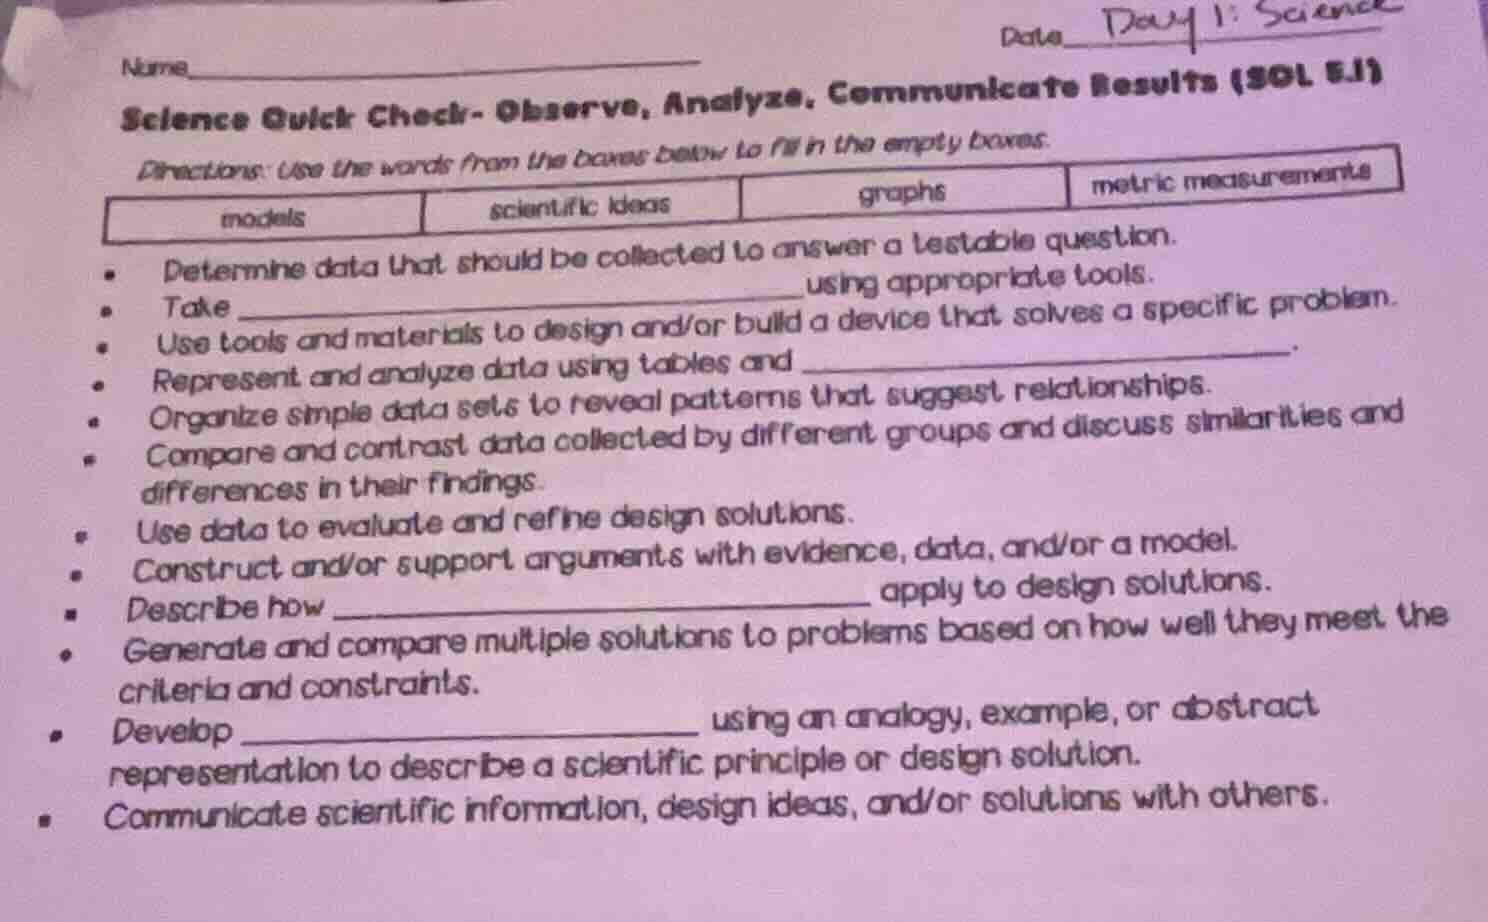
name____________________________ date day 1: science science quick check- observe, analyze, communicate results (sol 5.1) directions: use the words from the boxes below to fill in the empty boxes. models scientific ideas graphs metric measurements - determine data that should be collected to answer a testable question. - take _____________________ using appropriate tools. - use tools and materials to design and/or build a device that solves a specific problem. - represent and analyze data using tables and _____________________. - organize simple data sets to reveal patterns that suggest relationships. - compare and contrast data collected by different groups and discuss similarities and differences in their findings. - use data to evaluate and refine design solutions. - construct and/or support arguments with evidence, data, and/or a model. - describe how _____________________ apply to design solutions. - generate and compare multiple solutions to problems based on how well they meet the criteria and constraints. - develop _______________________ using an analogy, example, or abstract representation to describe a scientific principle or design solution. - communicate scientific information, design ideas, and/or solutions with others.
- The blank about collecting data with tools matches "metric measurements" as these are quantitative data gathered with scientific tools.
- The blank about representing data with tables pairs with "graphs", as graphs are a standard visual tool alongside tables for data analysis.
- The blank about applying concepts to design solutions fits "scientific ideas", as scientific concepts inform engineering/design work.
- The blank about creating analogies/abstract representations for scientific principles matches "models", as models are simplified representations of scientific ideas or systems.

Snap & solve any problem in the app
Get step-by-step solutions on Sovi AI
Photo-based solutions with guided steps
Explore more problems and detailed explanations
- Take metric measurements using appropriate tools.
- Represent and analyze data using tables and graphs.
- Describe how scientific ideas apply to design solutions.
- Develop models using an analogy, example, or abstract representation to describe a scientific principle or design solution.