QUESTION IMAGE
Question
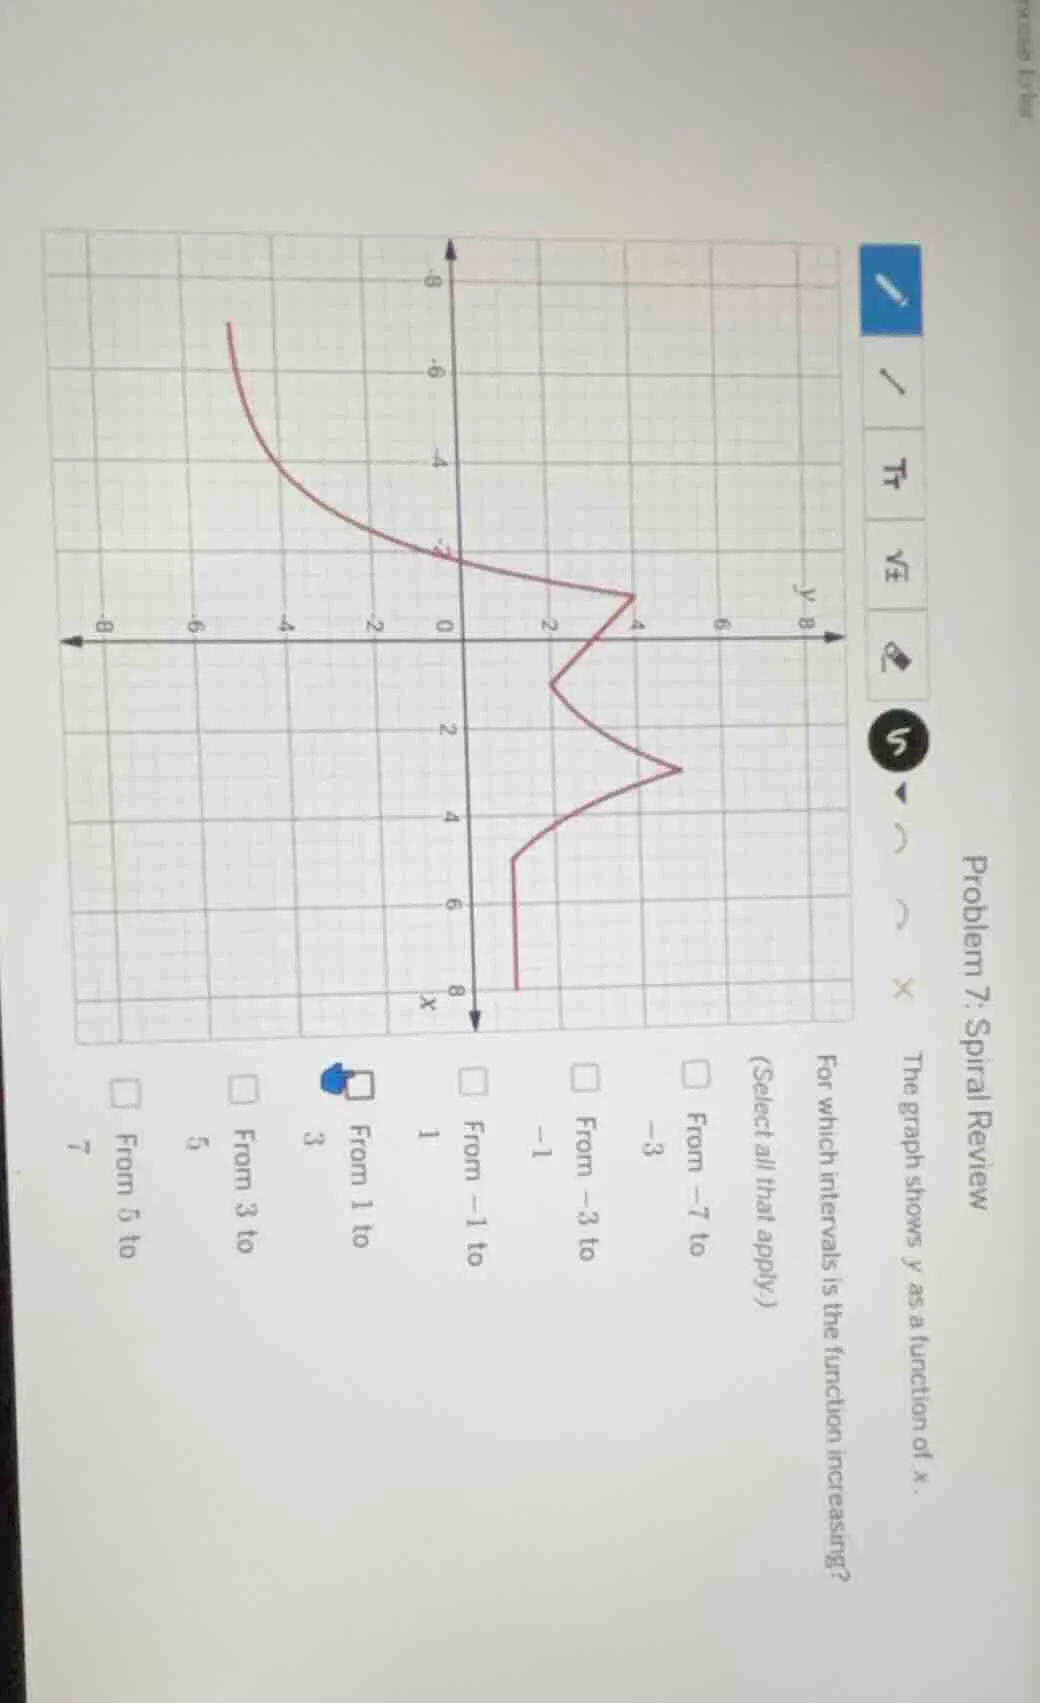
problem 7: spiral review
the graph shows y as a function of x.
for which intervals is the function increasing?
(select all that apply)
□ from −7 to −3
□ from −3 to −1
□ from −1 to 1
□ from 1 to 3
□ from 3 to 5
□ from 5 to 7
To determine when a function is increasing, we check if as \( x \) increases, \( y \) also increases (the graph rises from left to right) over an interval.
Step 1: Analyze "From -7 to -3"
For \( x \) from -7 to -3, as \( x \) increases (moves right), the \( y \)-values decrease (the graph falls). So this interval is not increasing.
Step 2: Analyze "From -3 to -1"
For \( x \) from -3 to -1, as \( x \) increases, the \( y \)-values decrease (graph falls). Not increasing.
Step 3: Analyze "From -1 to 1"
For \( x \) from -1 to 1, as \( x \) increases, the \( y \)-values decrease (graph falls). Not increasing.
Step 4: Analyze "From 1 to 3"
For \( x \) from 1 to 3, as \( x \) increases (moves right), the \( y \)-values increase (the graph rises). So this interval is increasing.
Step 5: Analyze "From 3 to 5"
For \( x \) from 3 to 5, as \( x \) increases, the \( y \)-values decrease (graph falls). Not increasing.
Step 6: Analyze "From 5 to 7"
For \( x \) from 5 to 7, as \( x \) increases, the \( y \)-values increase (graph rises). So this interval is increasing.

Snap & solve any problem in the app
Get step-by-step solutions on Sovi AI
Photo-based solutions with guided steps
Explore more problems and detailed explanations
- From 1 to 3
- From 5 to 7
(Note: The numbering in the options seems a bit off in the original, but based on the analysis, "From 1 to 3" and "From 5 to 7" are the intervals where the function is increasing.)