QUESTION IMAGE
Question
question
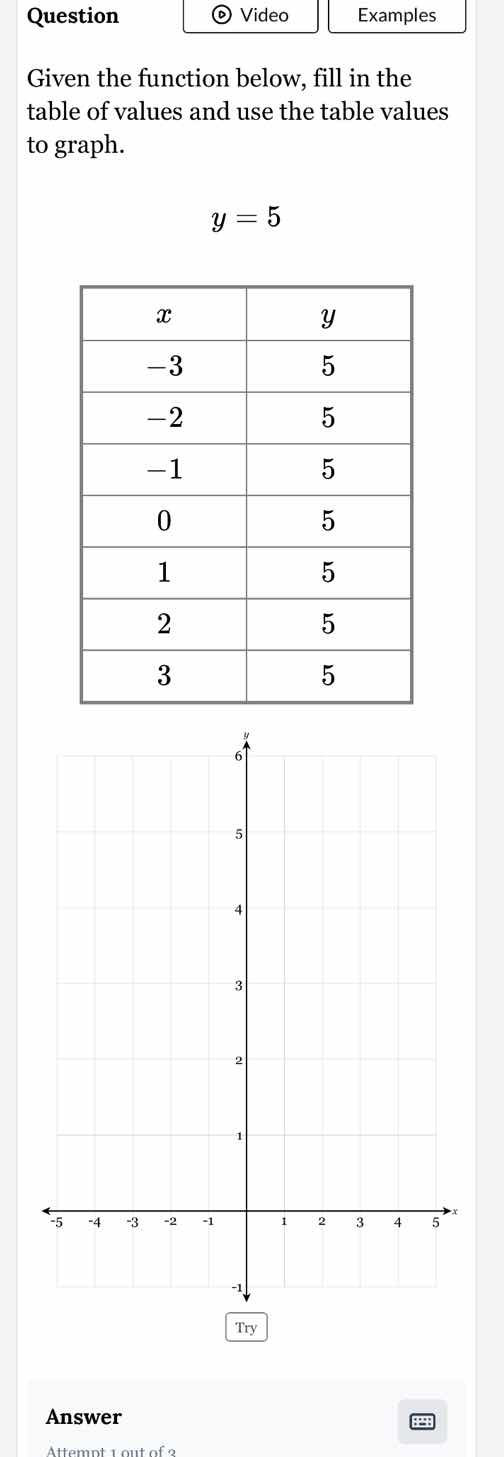
given the function below, fill in the
table of values and use the table values
to graph.
$y = 5$
| $x$ | $y$ |
|---|---|
| $-2$ | $5$ |
| $-1$ | $5$ |
| $0$ | $5$ |
| $1$ | $5$ |
| $2$ | $5$ |
| $3$ | $5$ |
(graph with x-axis from -5 to 5 and y-axis from -1 to 6, grid lines, and a try button below the graph)
answer
attempt 1 out of 3
Step1: Understand the function
The function is \( y = 5 \), which is a horizontal line. For any value of \( x \), \( y \) is always 5. So the table is already filled correctly as each \( x \) (from -3 to 3) has \( y = 5 \).
Step2: Graph the points
To graph, plot the points \((-3, 5)\), \((-2, 5)\), \((-1, 5)\), \((0, 5)\), \((1, 5)\), \((2, 5)\), \((3, 5)\) on the coordinate plane. Since all these points have the same \( y \)-coordinate (5), the graph is a horizontal line passing through \( y = 5 \), parallel to the \( x \)-axis.

Snap & solve any problem in the app
Get step-by-step solutions on Sovi AI
Photo-based solutions with guided steps
Explore more problems and detailed explanations
The table is filled with \( y = 5 \) for all given \( x \)-values. The graph is a horizontal line at \( y = 5 \) passing through the plotted points \((-3, 5)\), \((-2, 5)\), \((-1, 5)\), \((0, 5)\), \((1, 5)\), \((2, 5)\), \((3, 5)\).