QUESTION IMAGE
Question
question
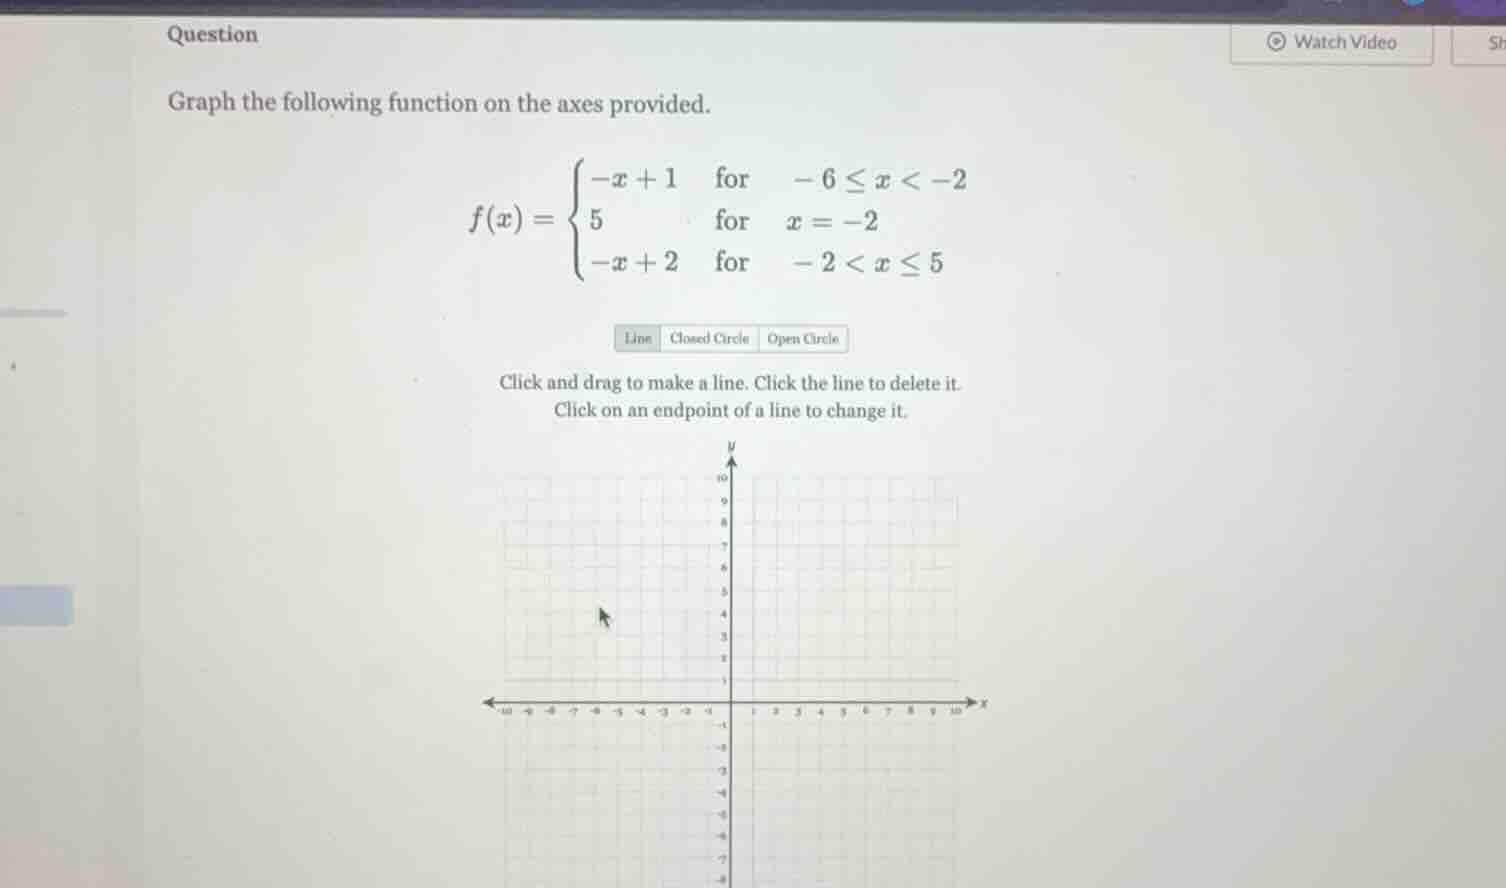
graph the following function on the axes provided.
\\( f(x) = \
\\)
line closed circle open circle
click and drag to make a line. click the line to delete it.
click on an endpoint of a line to change it.
Step1: Analyze the first piece
For \( f(x)=-x + 1 \) with \( -6\leq x<-2 \), find two endpoints. When \( x=-6 \), \( f(-6)=-(-6)+1 = 7 \) (closed circle at \((-6,7)\)). When \( x=-2 \), \( f(-2)=-(-2)+1 = 3 \) (open circle at \((-2,3)\)). Draw a line between these points.
Step2: Analyze the second piece
For \( f(x)=5 \) with \( x = -2 \), plot a closed circle at \((-2,5)\).
Step3: Analyze the third piece
For \( f(x)=-x + 2 \) with \( -2 (Note: Since this is a graphing problem, the above steps describe how to plot each part. The actual graphing would be done by following these steps on the provided coordinate system.)

Snap & solve any problem in the app
Get step-by-step solutions on Sovi AI
Photo-based solutions with guided steps
Explore more problems and detailed explanations
To graph the piecewise function:
- For \( -6\leq x<-2 \): Plot a closed circle at \((-6, 7)\), an open circle at \((-2, 3)\), and draw a line connecting them (using \( y=-x + 1 \)).
- For \( x=-2 \): Plot a closed circle at \((-2, 5)\).
- For \( -2
(The graph is constructed by combining these three parts as described.)