QUESTION IMAGE
Question
question
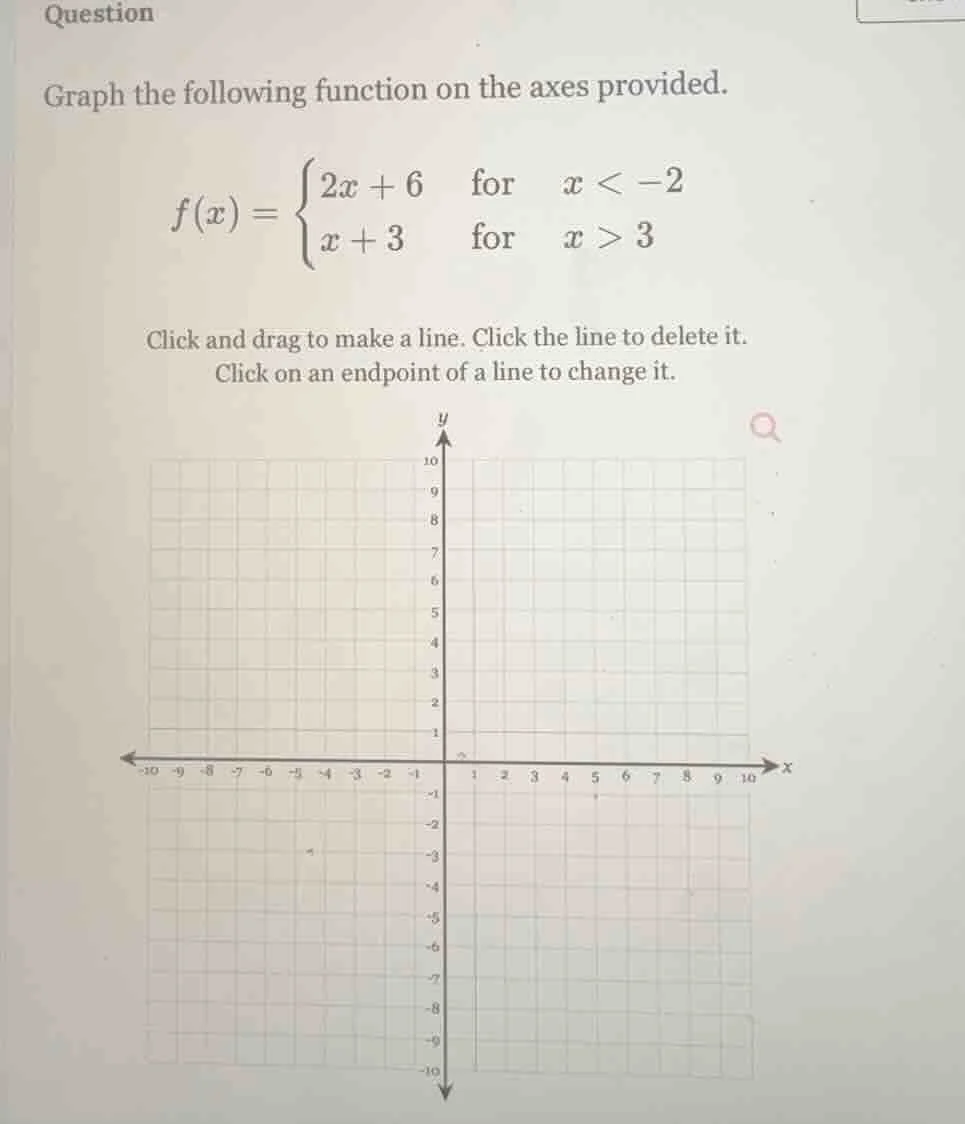
graph the following function on the axes provided.
$f(x)=\
$
click and drag to make a line. click the line to delete it.
click on an endpoint of a line to change it.
(graph axes with grid, y-axis from -10 to 10, x-axis from -10 to 10)
Step1: Analyze the first piece ($x < -2$)
The first piece is $f(x) = 2x + 6$ for $x < -2$. Let's find two points. When $x = -3$ (which is less than -2), $f(-3) = 2(-3) + 6 = 0$. When $x = -4$, $f(-4) = 2(-4) + 6 = -2$. Since $x < -2$, the endpoint at $x = -2$ is not included. So we have a line with slope 2 passing through $(-3, 0)$ and $(-4, -2)$, extending to the left (for more negative $x$).
Step2: Analyze the second piece ($x > 3$)
The second piece is $f(x) = x + 3$ for $x > 3$. Let's find two points. When $x = 4$ (which is greater than 3), $f(4) = 4 + 3 = 7$. When $x = 5$, $f(5) = 5 + 3 = 8$. Since $x > 3$, the endpoint at $x = 3$ is not included. So we have a line with slope 1 passing through $(4, 7)$ and $(5, 8)$, extending to the right (for more positive $x$).
To graph:
- For $f(x) = 2x + 6$ ($x < -2$): Plot the points $(-3, 0)$ and $(-4, -2)$ (and others for $x < -2$) and draw a line with slope 2, not including the point at $x = -2$ (so the endpoint at $x = -2$ is an open circle, but in the drag - and - drop tool, we can draw the line from left - ward points).
- For $f(x)=x + 3$ ($x > 3$): Plot the points $(4, 7)$ and $(5, 8)$ (and others for $x > 3$) and draw a line with slope 1, not including the point at $x = 3$ (so the endpoint at $x = 3$ is an open circle, and we draw the line from right - ward points).
(Note: Since this is a graphing problem, the final answer is the graphical representation as described. But in text - based, we can describe the steps to draw the graph. If we were to represent the key points:
For $y = 2x+6, x < - 2$:
- When $x=-3$, $y = 0$; when $x = - 4$, $y=-2$; when $x=-5$, $y = 2(-5)+6=-4$ etc. The line has a slope of 2 and is to the left of $x = - 2$ (open circle at $x=-2$, $y = 2(-2)+6 = 2$ but not included).
For $y=x + 3, x > 3$:
- When $x = 4$, $y = 7$; when $x = 5$, $y = 8$; when $x = 6$, $y = 9$ etc. The line has a slope of 1 and is to the right of $x = 3$ (open circle at $x = 3$, $y=3 + 3=6$ but not included).)

Snap & solve any problem in the app
Get step-by-step solutions on Sovi AI
Photo-based solutions with guided steps
Explore more problems and detailed explanations
To graph the piece - wise function:
- For $f(x)=2x + 6$ ($x < - 2$): Draw a line with slope 2 passing through points like $(-3,0)$, $(-4,-2)$ (and other points with $x < - 2$). The line should not include the point at $x=-2$ (open endpoint at $x = - 2$).
- For $f(x)=x + 3$ ($x > 3$): Draw a line with slope 1 passing through points like $(4,7)$, $(5,8)$ (and other points with $x > 3$). The line should not include the point at $x = 3$ (open endpoint at $x = 3$).
(If using the provided graphing tool, click and drag to create the lines as per the above - described points and slopes, ensuring the endpoints are adjusted to be open (not including $x=-2$ for the first line and $x = 3$ for the second line).)