QUESTION IMAGE
Question
question
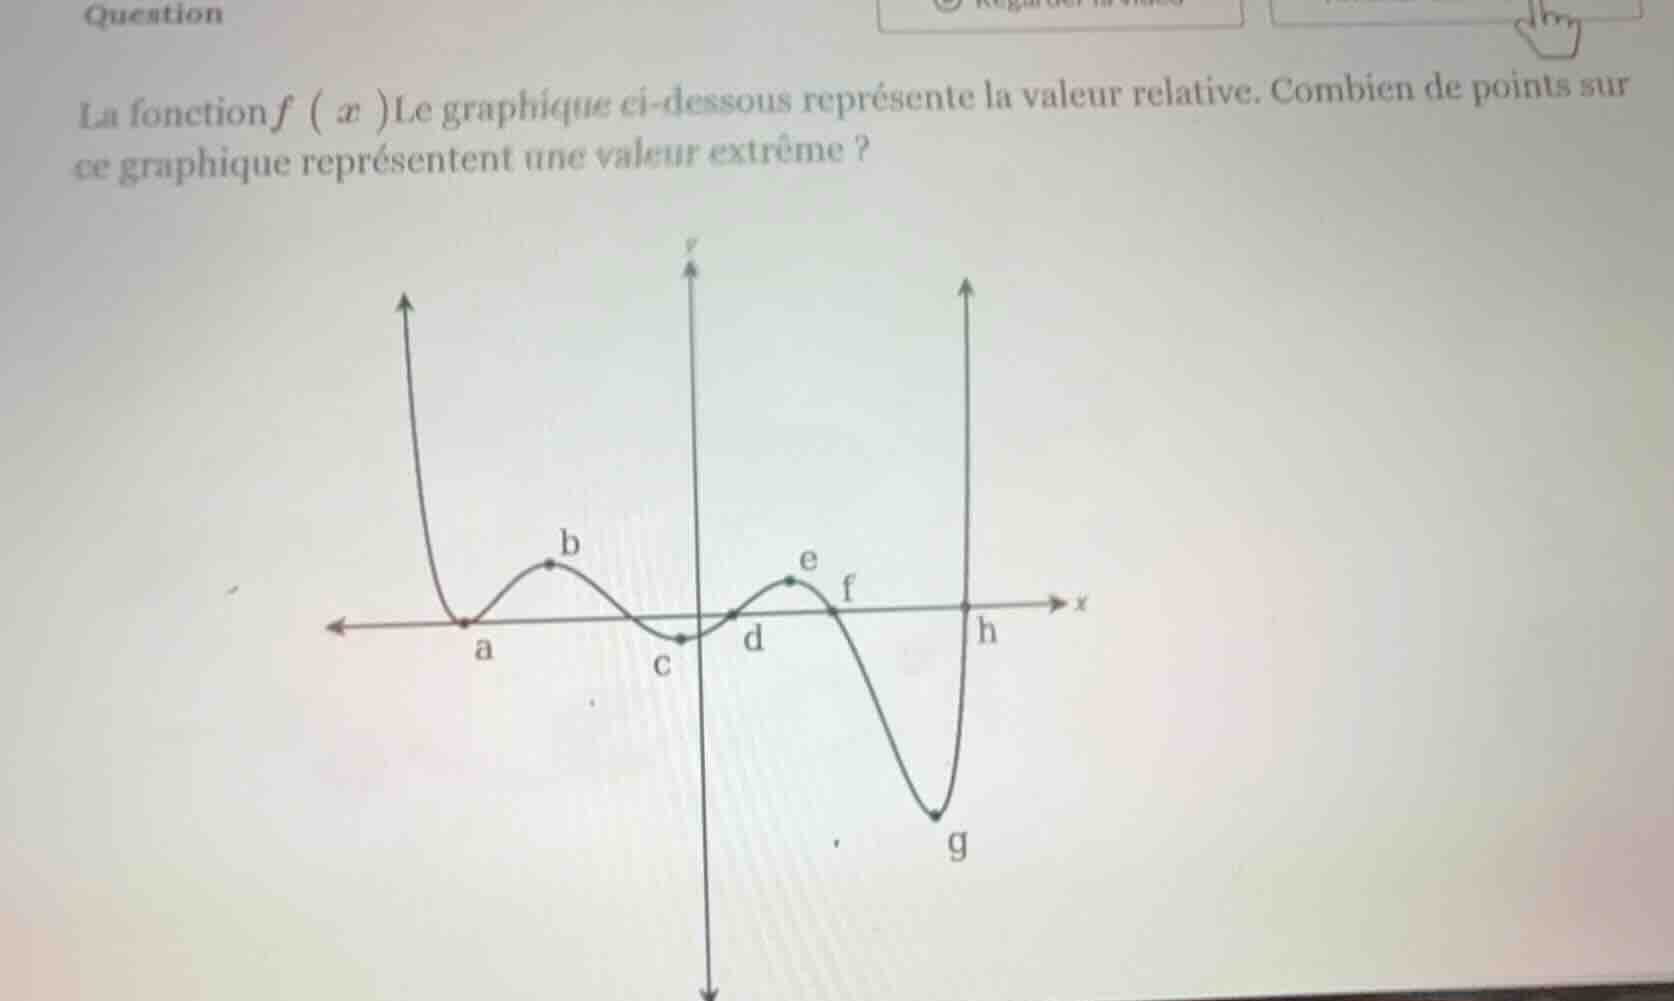
la fonction f(x) le graphique ci - dessous représente la valeur relative. combien de points sur ce graphique représentent une valeur extrême ?
Step1: Identify relative extrema
A relative (local) extremum is a point where the function changes from increasing to decreasing (local maximum) or decreasing to increasing (local minimum).
- Point b: Local maximum (function changes from increasing to decreasing)
- Point c: Local minimum (function changes from decreasing to increasing)
- Point e: Local maximum (function changes from increasing to decreasing)
- Point g: Local minimum (function changes from decreasing to increasing)
Points a, d, f, h are intercepts where the function does not change direction in a way that creates an extremum.
Step2: Count the extrema
Count the identified local extrema: b, c, e, g.

Snap & solve any problem in the app
Get step-by-step solutions on Sovi AI
Photo-based solutions with guided steps
Explore more problems and detailed explanations
4