QUESTION IMAGE
Question
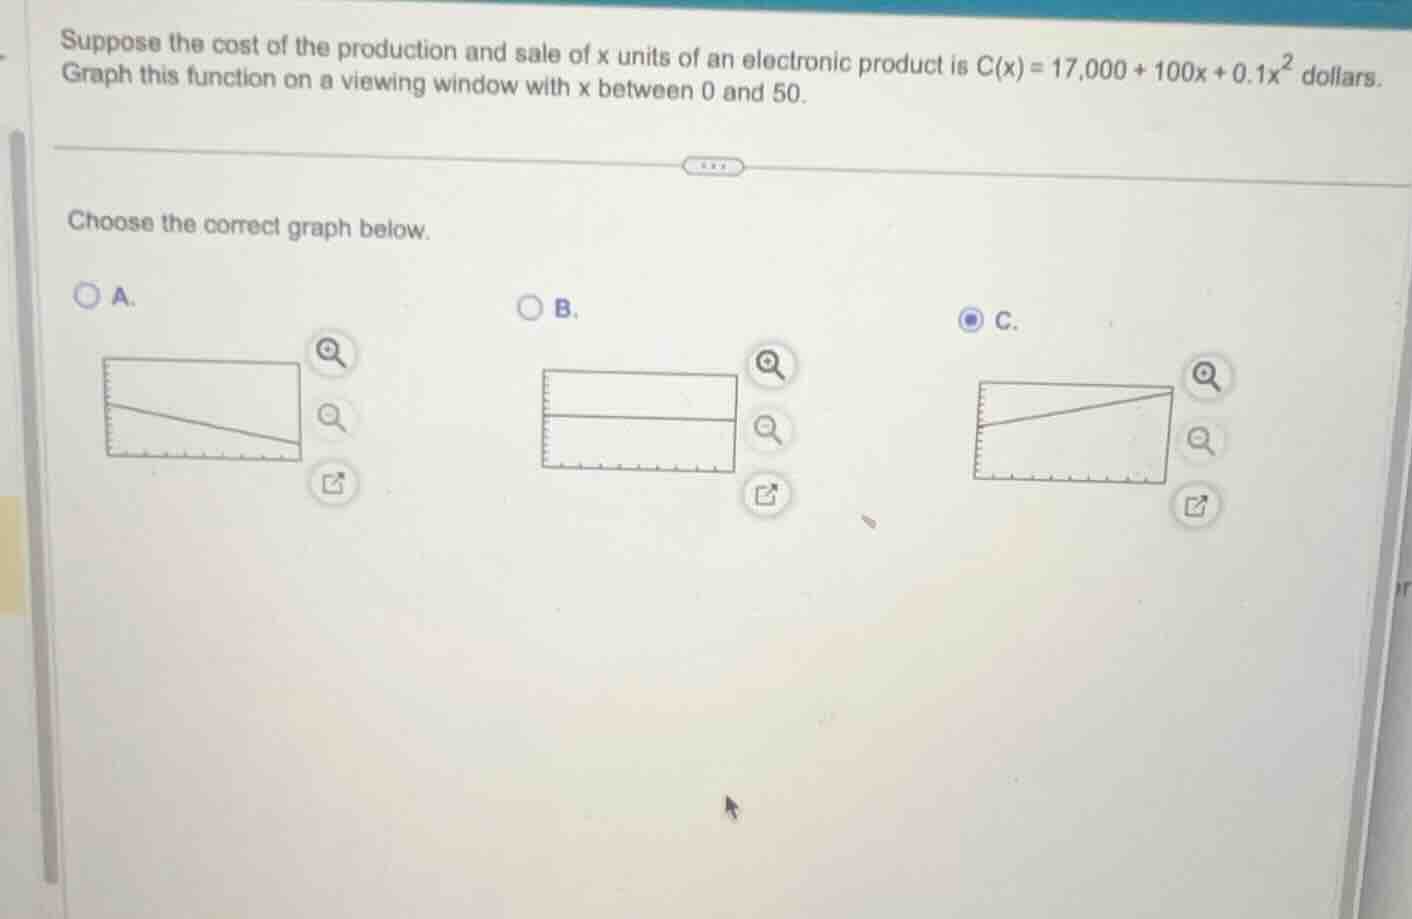
suppose the cost of the production and sale of x units of an electronic product is $c(x) = 17,000 + 100x + 0.1x^2$ dollars. graph this function on a viewing window with x between 0 and 50. choose the correct graph below. \\(\bigcirc\\) a. \\(\bigcirc\\) b. \\(\bigcirc\\) c.
Step1: Identify function type
The function $C(x)=17,000 + 100x + 0.1x^2$ is a quadratic function with a positive leading coefficient ($0.1>0$), so it opens upward. On the interval $x\in[0,50]$, it will be an increasing curve (since the vertex of $ax^2+bx+c$ is at $x=-\frac{b}{2a}=-\frac{100}{2\times0.1}=-500$, which is far left of our interval, so the function increases on $[0,50]$).
Step2: Evaluate endpoints
- At $x=0$: $C(0)=17,000 + 100(0) + 0.1(0)^2=17000$
- At $x=50$: $C(50)=17,000 + 100(50) + 0.1(50)^2=17000+5000+250=22250$
The function starts at 17000 and increases to 22250 on $[0,50]$, so the graph should be an upward-sloping (increasing) curve/line (the quadratic term is small, so it will appear nearly linear on this interval).
Step3: Match to options
Option A is decreasing, Option B is constant, Option C is increasing, which matches our analysis.

Snap & solve any problem in the app
Get step-by-step solutions on Sovi AI
Photo-based solutions with guided steps
Explore more problems and detailed explanations
C. <The upward-sloping graph shown in option C>