QUESTION IMAGE
Question
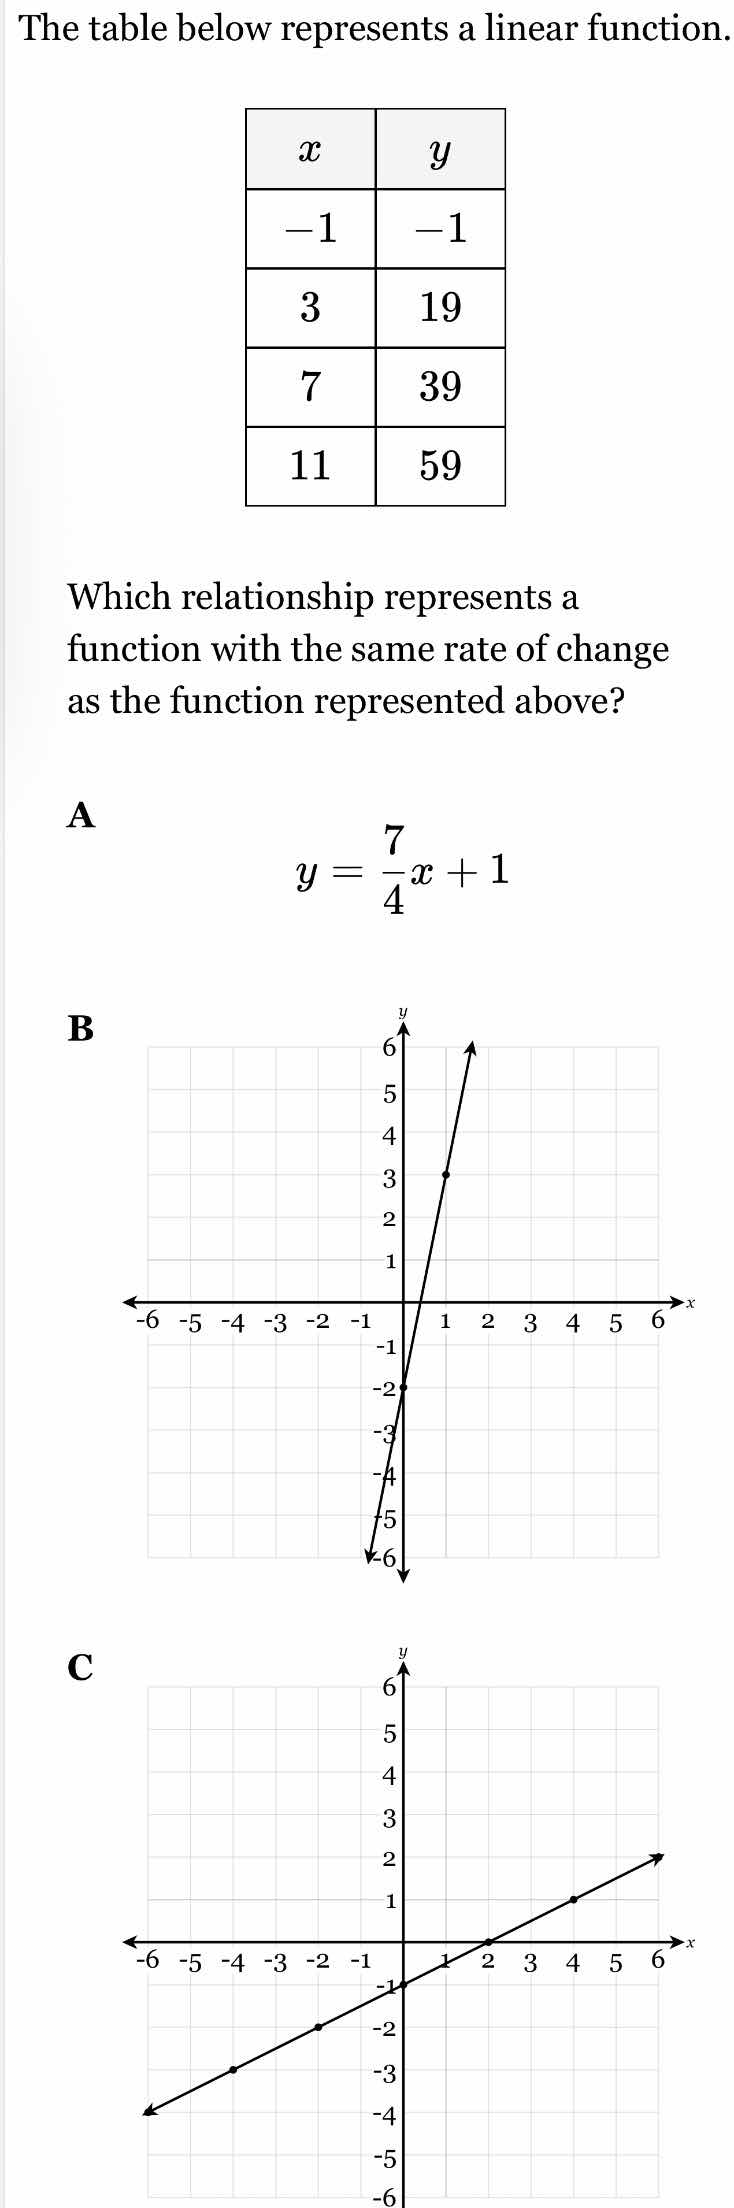
the table below represents a linear function.
| $x$ | $y$ |
|---|---|
| $3$ | $19$ |
| $7$ | $39$ |
| $11$ | $59$ |
which relationship represents a function with the same rate of change as the function represented above?
a
$y = \dfrac{7}{4}x + 1$
b
graph of a line in a coordinate plane with x-axis from -6 to 6 and y-axis from -6 to 6. the line passes through (0, -2) and (1, 3).
c
graph of a line in a coordinate plane with x-axis from -6 to 6 and y-axis from -6 to 6. the line passes through (0, -1) and (2, 0).
Step1: Find slope of given table
Use two points \((x_1,y_1)=(-1,-1)\) and \((x_2,y_2)=(3,19)\).
Slope formula: \(m = \frac{y_2 - y_1}{x_2 - x_1}\)
\(m=\frac{19 - (-1)}{3 - (-1)}=\frac{20}{4}=5\)
Step2: Analyze Option A
Equation: \(y=\frac{7}{4}x + 1\)
Slope \(m=\frac{7}{4}
eq5\), so A is wrong.
Step3: Analyze Option B
Points from graph: \((0,-2)\) and \((1,3)\).
Slope: \(m=\frac{3 - (-2)}{1 - 0}=\frac{5}{1}=5\), matches the slope.
Step4: Analyze Option C (optional, but confirm)
Points from graph: \((0,-1)\) and \((2,0)\).
Slope: \(m=\frac{0 - (-1)}{2 - 0}=\frac{1}{2}
eq5\), so C is wrong.

Snap & solve any problem in the app
Get step-by-step solutions on Sovi AI
Photo-based solutions with guided steps
Explore more problems and detailed explanations
B