QUESTION IMAGE
Question
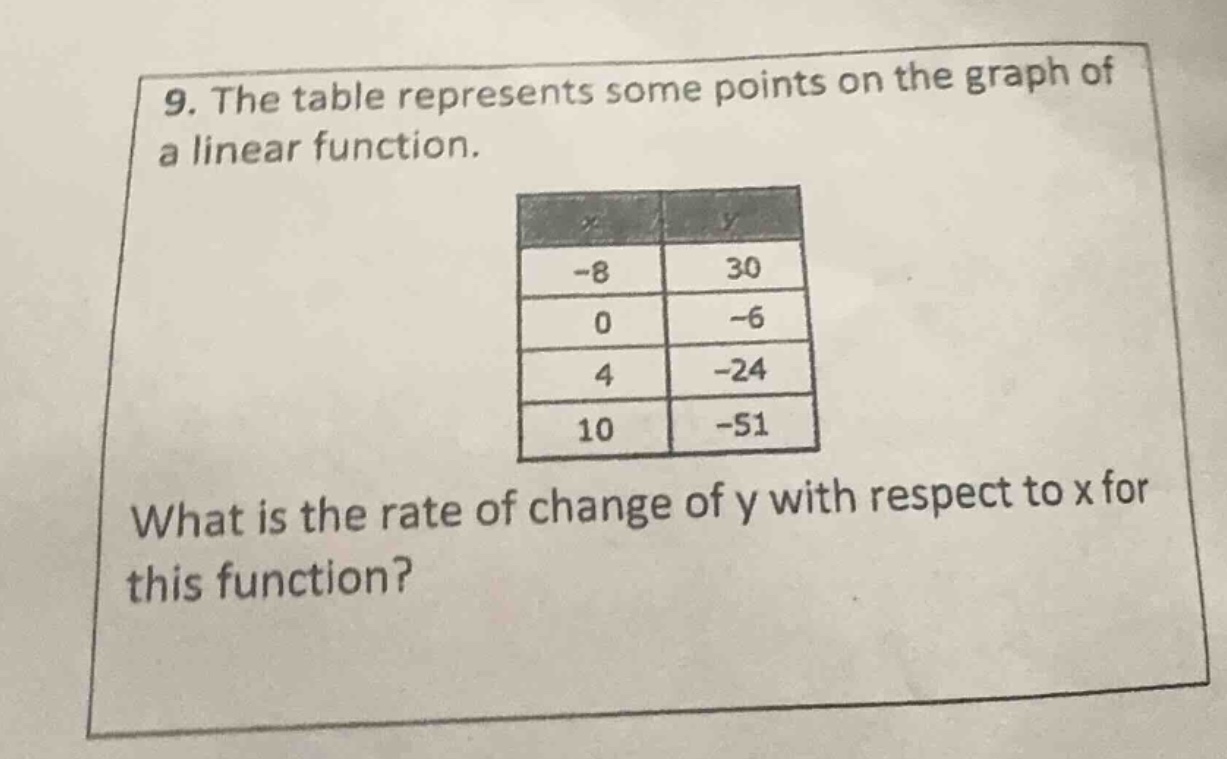
- the table represents some points on the graph of a linear function. what is the rate of change of y with respect to x for this function?
Step1: Recall rate of change formula
For a linear function, the rate of change (slope) between two points \((x_1, y_1)\) and \((x_2, y_2)\) is given by \(m=\frac{y_2 - y_1}{x_2 - x_1}\). We can use two points from the table, e.g., \((0, - 6)\) and \((4, - 24)\).
Step2: Substitute values into formula
Let \(x_1 = 0\), \(y_1=-6\), \(x_2 = 4\), \(y_2=-24\). Then \(m=\frac{-24-(-6)}{4 - 0}=\frac{-24 + 6}{4}=\frac{-18}{4}=-\frac{9}{2}=-4.5\). We can check with another pair, say \((-8,30)\) and \((0, - 6)\): \(m=\frac{-6 - 30}{0-(-8)}=\frac{-36}{8}=-\frac{9}{2}\), same result.

Snap & solve any problem in the app
Get step-by-step solutions on Sovi AI
Photo-based solutions with guided steps
Explore more problems and detailed explanations
\(-\frac{9}{2}\) (or -4.5)