QUESTION IMAGE
Question
understand and graph functions
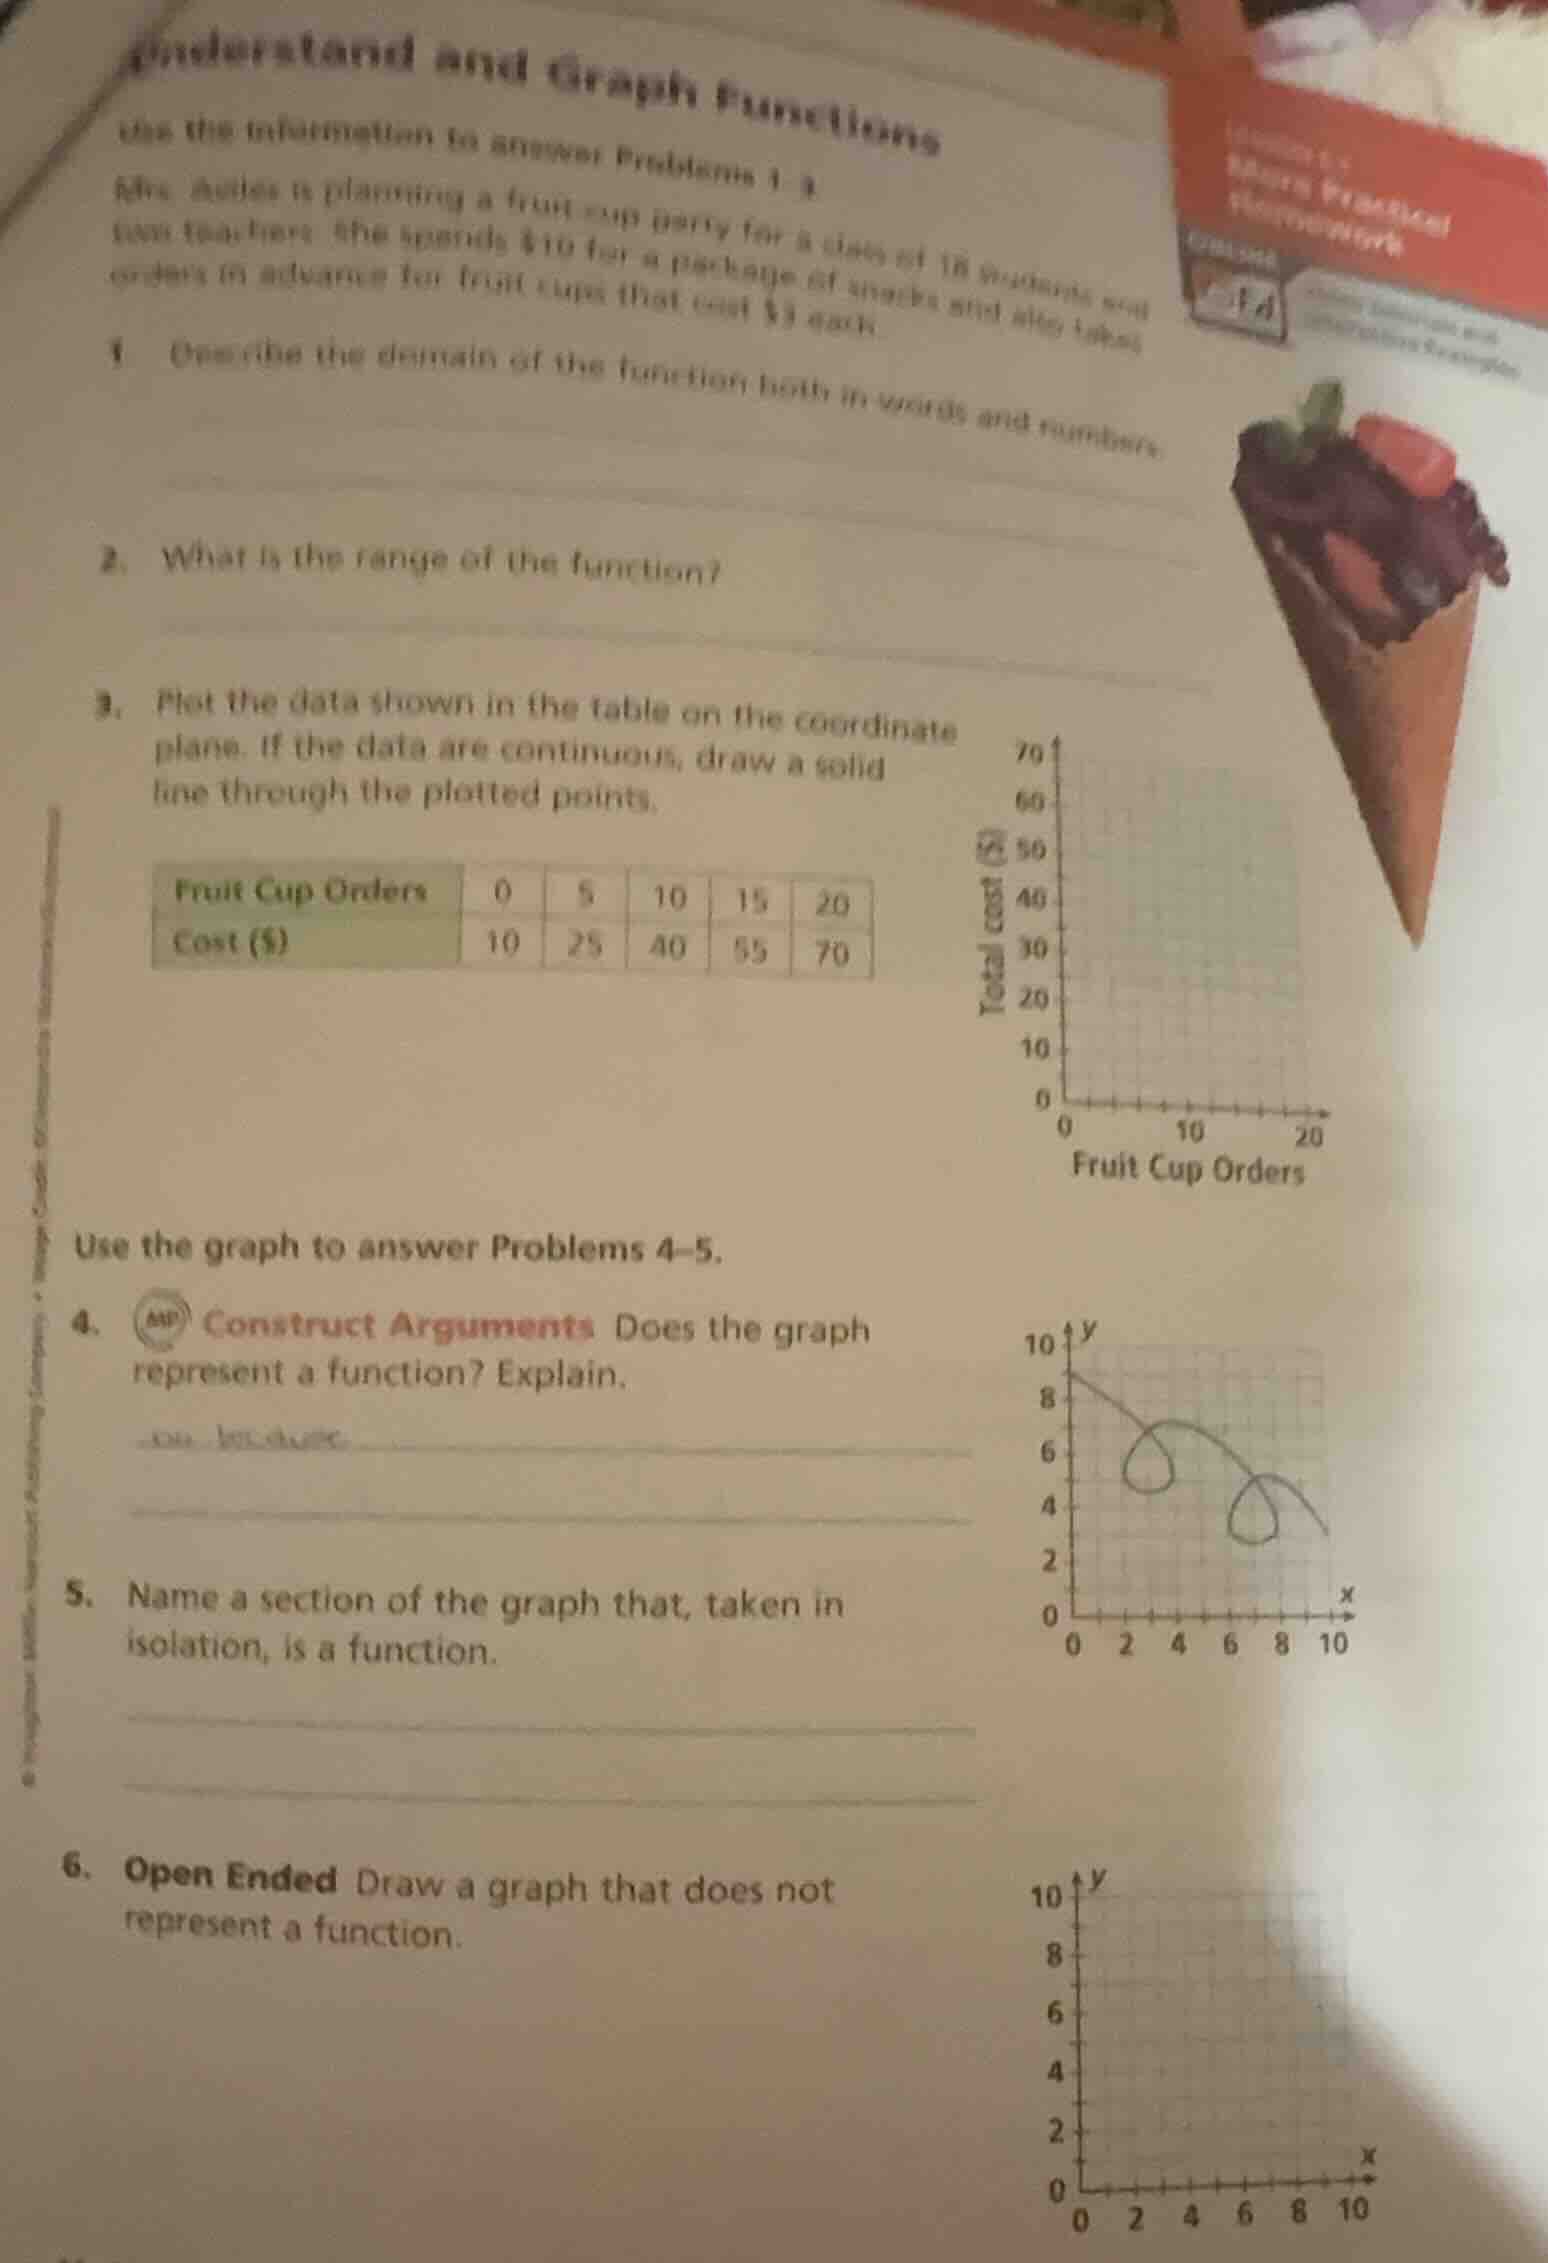
use the information to answer problems 1–3.
mrs. dubois is planning a fruit cup party for a class of 18 students and two teachers. she spends $10 for a package of snacks and also takes orders in advance for fruit cups that cost $3 each.
- describe the domain of the function both in words and numbers.
- what is the range of the function?
- plot the data shown in the table on the coordinate plane. if the data are continuous, draw a solid line through the plotted points.
| fruit cup orders | 0 | 5 | 10 | 15 | 20 |
|---|
(graph with x - axis: fruit cup orders, y - axis: total cost ($), with scales 0,10,20 on x and 0,10,20,30,40,50,60,70 on y)
use the graph to answer problems 4–5.
- construct arguments does the graph represent a function? explain.
(graph with x from 0 - 10, y from 0 - 10, with a curved line having loops)
- name a section of the graph that, taken in isolation, is a function.
- open ended draw a graph that does not represent a function.
(graph with x from 0 - 10, y from 0 - 10, blank for drawing)
Step1: Define domain (words/numbers)
Words: The number of fruit cup orders (non-negative integers, up to a reasonable maximum for 18 students + 2 teachers, so 0 to 20 as given, or all non-negative integers where orders make sense for the group).
Numbers: $\{0, 5, 10, 15, 20\}$ (discrete values from the table; can also be all integers $0 \leq x \leq 20$ since partial orders don't make sense)
Step2: Identify range from table
Extract cost values from the table.
Range values: $\{10, 25, 40, 55, 70\}$
Step3: Plot points (summary)
Plot coordinates: $(0,10), (5,25), (10,40), (15,55), (20,70)$. Since you can't order partial fruit cups, the data is discrete, so no solid line.
Step4: Test function for graph 4
Apply vertical line test: A vertical line intersects the graph at more than one point (the loops), so it fails.
Step5: Identify valid function section
Choose a section where no vertical line intersects more than once, e.g., the leftmost segment from $x=0$ to $x=3$.
Step6: Draw non-function graph
Create a graph that fails the vertical line test, e.g., a vertical line $x=5$, or a circle $x^2 + y^2 = 25$.

Snap & solve any problem in the app
Get step-by-step solutions on Sovi AI
Photo-based solutions with guided steps
Explore more problems and detailed explanations
- Domain (Words): The number of fruit cup orders (non-negative whole numbers, from 0 up to 20, since that covers the possible orders for the group).
Domain (Numbers): $\{0, 5, 10, 15, 20\}$ (or all integers where $0 \leq x \leq 20$)
- Range: $\{10, 25, 40, 55, 70\}$
- (Plotted points: $(0,10)$, $(5,25)$, $(10,40)$, $(15,55)$, $(20,70)$; no solid line, as data is discrete)
- No, the graph does not represent a function. It fails the vertical line test: a vertical line drawn through the loops will intersect the graph at more than one point, meaning one $x$-value maps to multiple $y$-values.
- The segment of the graph from $x=0$ to $x=3$ (any segment where a vertical line only intersects the graph once is valid).
- (Example graph: A vertical line $x=5$, or a circle centered at the origin with radius 5, which fails the vertical line test.)