QUESTION IMAGE
Question
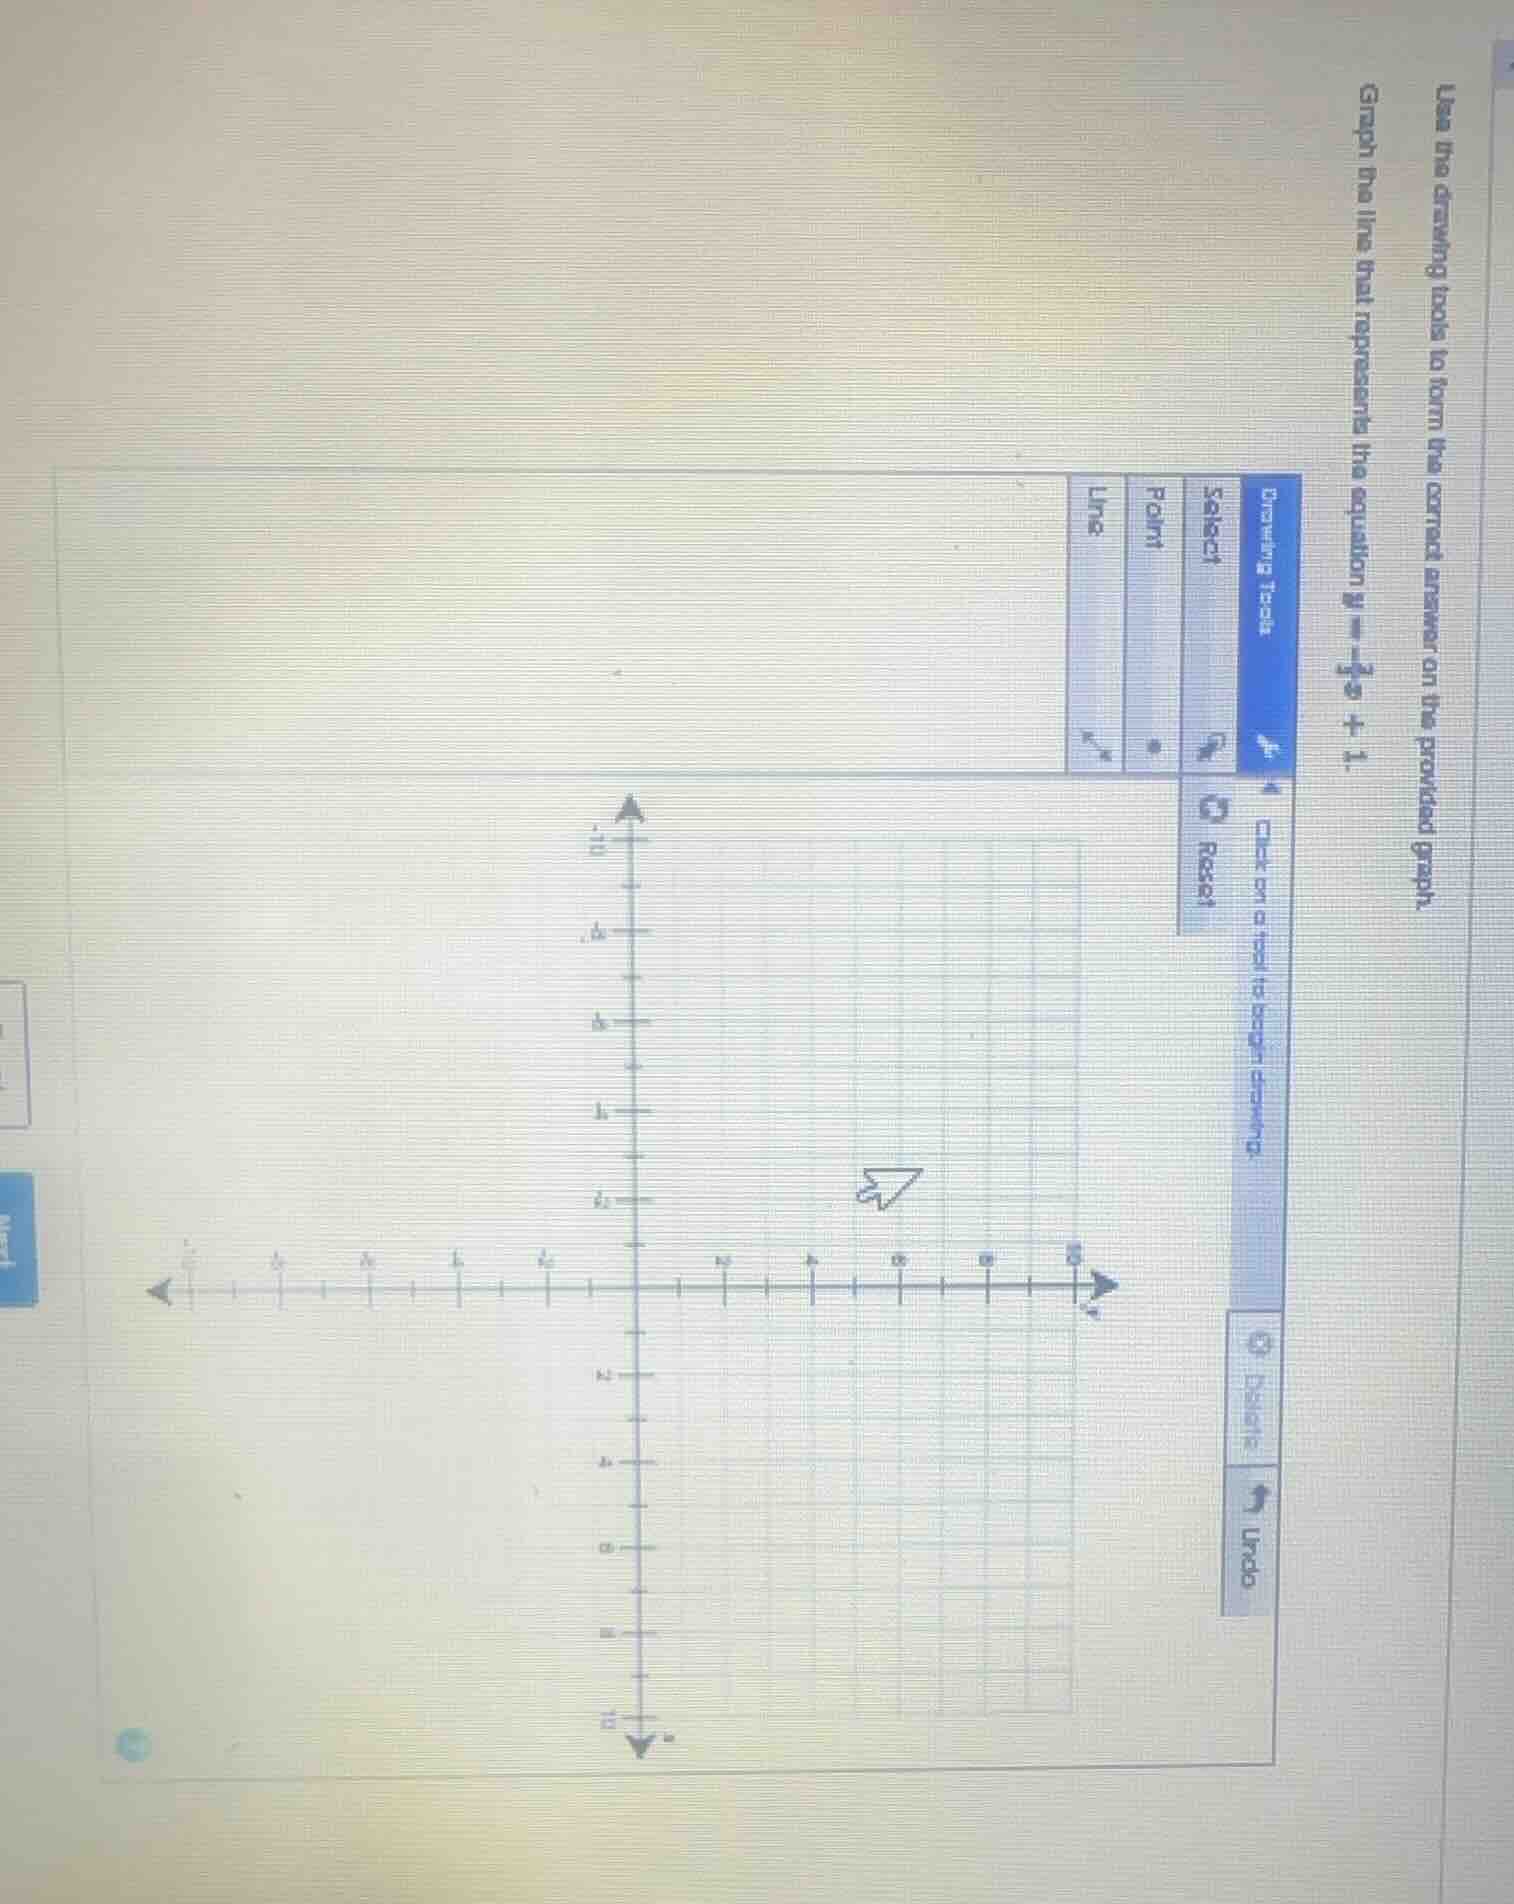
use the drawing tools to form the correct answer on the provided graph. graph the line that represents the equation $y = -\frac{1}{3}x + 1$.
Step1: Identify the slope and y-intercept
The equation is in slope - intercept form \(y = mx + b\), where \(m\) is the slope and \(b\) is the y - intercept. For the equation \(y=-\frac{1}{3}x + 1\), the y - intercept \(b = 1\) and the slope \(m=-\frac{1}{3}\).
Step2: Plot the y-intercept
The y - intercept is the point where \(x = 0\). So, we plot the point \((0,1)\) on the coordinate plane.
Step3: Use the slope to find another point
The slope \(m =-\frac{1}{3}=\frac{\text{rise}}{\text{run}}\). The negative sign means we can go down 1 unit (rise) and then 3 units to the right (run), or up 1 unit and 3 units to the left. Starting from \((0,1)\), if we go down 1 unit and 3 units to the right, we get the point \((0 + 3,1-1)=(3,0)\). If we go up 1 unit and 3 units to the left, we get the point \((0 - 3,1 + 1)=(-3,2)\).
Step4: Draw the line
Using the two points (for example, \((0,1)\) and \((3,0)\)) or more, we draw a straight line passing through these points.
(Note: Since this is a graphing problem, the final answer is the graph of the line \(y =-\frac{1}{3}x+1\) passing through points like \((0,1)\) and \((3,0)\) or other points obtained using the slope - intercept method.)

Snap & solve any problem in the app
Get step-by-step solutions on Sovi AI
Photo-based solutions with guided steps
Explore more problems and detailed explanations
The line is graphed by plotting the y - intercept \((0,1)\) and then using the slope \(-\frac{1}{3}\) to find another point (e.g., \((3,0)\)) and drawing a straight line through these points.