QUESTION IMAGE
Question
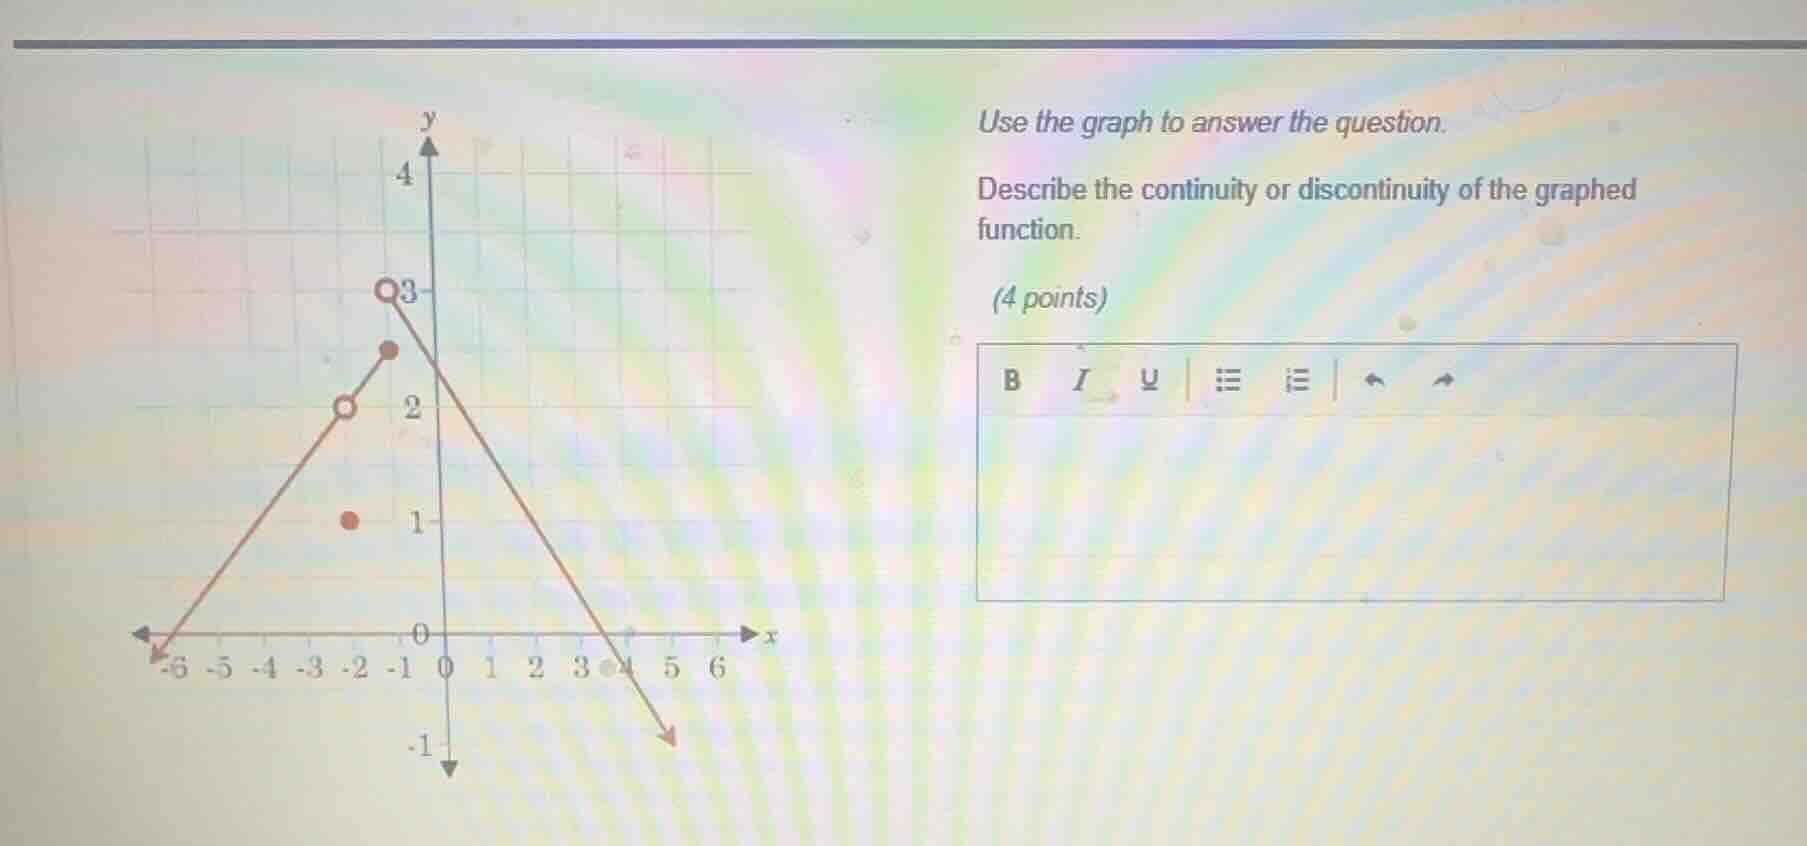
use the graph to answer the question.
describe the continuity or discontinuity of the graphed function.
(4 points)
Brief Explanations
- Continuous Intervals: The function is continuous over $(-6, -2)$, $(-2, 0)$, and $(0, \infty)$ because the graph has no breaks, holes, or jumps in these ranges.
- Discontinuity at $x=-2$: There is a removable discontinuity (hole) at $x=-2$: the limit of the function exists here, but the function's defined value at $x=-2$ (the filled point at $y=1$) does not match the limit value.
- Discontinuity at $x=0$: There is a jump discontinuity at $x=0$: the left-hand limit (from $x<0$) and right-hand limit (from $x>0$) of the function are not equal, and the function has a defined value at $x=0$ (the filled point at $y=3$).
- Endpoint Behavior: At $x=-6$, the function has a defined value and is continuous from the right, matching the start of its domain.

Snap & solve any problem in the app
Get step-by-step solutions on Sovi AI
Photo-based solutions with guided steps
Explore more problems and detailed explanations
The function is continuous on the intervals $(-6, -2)$, $(-2, 0)$, and $(0, \infty)$.
- At $x=-2$, the function has a removable discontinuity (the limit exists, but the function's value at this point does not match the limit).
- At $x=0$, the function has a jump discontinuity (the left-hand and right-hand limits do not match, while the function has a defined value here).
- The function is defined and continuous from the right at its left endpoint $x=-6$.